Beyond A/B Testing: Causal Inference in the Wild (DiD, PSM, and IV)
What changes when clean random assignment is unavailable: the identification assumptions, estimands, and diagnostics behind Difference-in-Differences, Propensity Score Matching, and Instrumental Variables.
Part of the statistical-inference arc. It builds on designing a trustworthy A/B test and sample size and power, and leads into multi-armed bandits.
Earlier posts in this series on statistical testing covered 2-sample t-tests, ANOVA, and Chi-Square tests. Those tools are fantastic for randomized, perfectly controlled A/B tests. But what happens when we can’t perfectly randomize? What happens when the real world gets messy?
In this article, we are stepping into the realm of Causal Inference. We will explore three robust methods to measure true uplift when standard A/B testing fails: Difference-in-Differences (DiD), Propensity Score Matching (PSM), and Instrumental Variables (IV).
One idea sits underneath all three, and it is worth stating before we write a single line of code: a statistical model does not create causality. Each of these methods identifies a specific causal quantity (an estimand) only when a set of design-specific assumptions holds. Randomization earns those assumptions by construction. Observational data does not, so the assumptions become things we must argue for and probe, not results the regression hands us. Every section below therefore names three things: what the method estimates, what it assumes, and how we would catch it failing.
To anchor these concepts, let’s use a continuous backdrop: A Cricket Coaching Academy.
1. The Setup: The Cricket Academy Problem
Imagine we run a cricket academy with 100 students. We’ve been tracking their Batting Averages. Suddenly, a prominent International Player offers to guest-coach a batch of our students for one month.
Our objective as Data Scientists: Measure the exact uplift (in runs) caused by the International Player’s coaching.
Why the Standard 2-Sample T-Test Fails
Our first instinct might be to split the kids, let the month pass, and run a 2-sample t-test comparing the final Batting Averages of the Control Group vs. the Treatment (Pro Coach) Group.
The fatal flaw here is the “Snapshot Problem”. A standard t-test is cross-sectional, it only looks at the final score.
- What if the Control group started with an average of 40 and ended at 42?
- What if the Treatment group started at 20 and ended at 30?
A t-test would simply compare 42 vs. 30 and conclude the Control group is “better,” completely missing the massive +10 uplift achieved by the Pro coach.
One important caveat, though, before we blame the t-test. If we did randomize the 100 kids into the two groups, this failure would not actually happen in expectation. Randomization makes the two groups equal on their baselines on average, so the pre-training averages would both be about 20, and the post-only difference in means would be an unbiased estimate of the coaching effect. A t-test on post scores is not “wrong” for a randomized experiment. The most it costs us is precision: if baseline skill is highly predictive of the final score, ignoring it inflates the variance. The standard fix there is not DiD but ANCOVA, regressing the outcome on the treatment indicator and the pre-score.
The snapshot problem bites hard in a different situation: when the groups do not start equal, because assignment was not random. That is the world DiD, matching, and instrumental variables are actually built for, and it is where we are headed. Read the 42-vs-30 example that way: it is a warning about non-randomized comparisons, where a raw post-treatment gap silently mixes the treatment effect with a pre-existing gap between the groups.
2. Difference-in-Differences (DiD): The Time-Aware Approach
DiD comes into its own when we have pre/post data on two groups but assignment was not clean random, say one batch got the guest coach because of their practice schedule, not a coin flip. Instead of comparing final scores (which would mix the coaching effect with the pre-existing gap between the batches), DiD compares trajectories. We will develop it on the cricket academy, and to keep the mechanics simple we start with balanced groups before returning to the messier, non-random case in the PSM and IV sections.
The Intuition
DiD isolates the Treatment Effect from the Time Effect. Even without the special coach, kids naturally improve over a month due to regular practice. DiD calculates the natural growth of the Control group and subtracts it from the growth of the Treatment group.
The DiD Equation:
\[\text{Uplift} = (\bar{Y}_{Treatment\_Post} - \bar{Y}_{Treatment\_Pre}) - (\bar{Y}_{Control\_Post} - \bar{Y}_{Control\_Pre})\]Let’s plug in some hypothetical numbers. Suppose our regular students (Control) improved their batting average from 20.0 to 22.0 over the month (a +2.0 natural gain). The students training with the Pro (Treatment) improved from 20.0 to 28.0 (a +8.0 gain).
Uplift = (28.0 - 20.0) - (22.0 - 20.0) = 8.0 - 2.0 = +6.0 runs.
What DiD Assumes (and How It Fails)
That subtraction only recovers the causal effect if a chain of assumptions holds. The estimand it targets is the ATT (Average Treatment effect on the Treated: the effect of the coach on the batch that actually received it), and it is credible only when:
- Parallel trends. Absent the coach, the Treatment group’s average would have moved by the same amount as the Control group’s. This is the load-bearing assumption, and it is about a counterfactual we never observe.
- No anticipation. Kids (or parents) don’t change behaviour before the coaching starts because they know it is coming.
- No interference / spillovers. Coached kids don’t lift their un-coached friends’ scores by sharing tips, which would contaminate the control trajectory.
- Stable composition. The same students are in each group before and after. If the weakest treated kids drop out, the treated average rises for a reason that has nothing to do with the coach.
- No coincident shock. Nothing else that hits only one group at the same time (a new net in the treated nets, an exam week for the controls) gets mistaken for the treatment.
A crucial limitation of our toy setup: with a single pre-period, parallel trends cannot be tested at all. One “before” measurement per group tells us where the lines start, not whether they were moving in parallel. In practice we collect several pre-treatment periods and inspect an event-study plot (the treated-minus-control gap in each period): roughly flat pre-treatment gaps are the visible signature of parallel trends. Even then, a non-significant pre-trend test does not prove the assumption; it only fails to reject it.
One more caveat for the real world: when different groups adopt treatment at different times (staggered rollout) and the effect varies across groups, the conventional two-way fixed-effects regression can produce a weighted average with negative weights and mislead badly. Modern group-time estimators fix this; the Callaway and Sant’Anna (2021) estimator is the standard reference.
The “So What?” Problem: Proving the ROI
We found an average uplift of +6.0 runs. But is this a reliable result, or just a lucky month for a few kids in the Treatment group? A single point estimate (the number 6.0) doesn’t tell us anything about the variance or spread of the underlying data.
From a practical business perspective, this distinction matters immensely. The International Player isn’t coaching out of the goodness of their heart - they charge a premium fee. Before we sign a lucrative contract to retain them for the rest of the year, we need to prove this +6.0 is statistically significant (highly unlikely to be random noise). If the students’ scores are wildly scattered and the result is just a statistical mirage, paying for the coach is a terrible investment.
The Mathematical Formulation (OLS Regression)
To get those crucial confidence intervals and p-values, we can’t just do napkin math. We must formulate DiD as a robust statistical model. We achieve this using an Ordinary Least Squares (OLS) regression with an interaction term:
\[Y_{it} = \beta_0 + \beta_1(\text{Group}_i) + \beta_2(\text{Time}_t) + \beta_3(\text{Group}_i \times \text{Time}_t) + \epsilon_{it}\]Here is the rationale behind the components of the equation:
- $Y_{it}$ (Outcome): The batting average for a specific student $i$ at a specific time period $t$.
- $\beta_0$ (Intercept): The baseline batting average of the Control group at Time 0.
- $\beta_1$ (Group Effect): Controls for the baseline difference between the groups (the starting skill gap).
- $\beta_2$ (Time Effect): Controls for the natural time trend (the parallel improvement everyone experiences).
- $\beta_3$ (The DiD Estimator / True Uplift): By isolating the interaction between being in the Treatment group and being in the Post-training time period, it extracts the exact value added by the coach. Because it’s a regression coefficient, it comes complete with standard errors and a p-value to guide our financial decision.
- $\epsilon_{it}$ (Error Term): The random noise or unobserved individual factors for that specific student.
Interpreting a specific instance ($Y_{it}$):
To see how this works in practice, let’s calculate the expected batting average for a student in the Treatment Group after the 1-month training (Post-test), using our previous toy numbers ($\beta_0 = 20.0$, $\beta_1 = 0.0$ assuming no baseline difference, $\beta_2 = 2.0$, and the uplift $\beta_3 = 6.0$):
- For this specific scenario, we plug in $Group_i = 1$ (Treatment) and $Time_t = 1$ (Post-test).
- The equation becomes: $Y_{it} = 20.0 + 0.0(1) + 2.0(1) + 6.0(1 \times 1) + \epsilon_{it}$
- Solving this gives us: $Y_{it} = 28.0 + \epsilon_{it}$
This tells us that we expect this specific student to score a $28.0$, plus or minus some individual random variance ($\epsilon_{it}$). The OLS equation elegantly builds the final score by systematically layering the baseline, the natural time trend, and the coach’s specific uplift!
DiD Python Simulation
1
2
3
4
5
6
7
8
9
10
11
12
13
14
15
16
17
18
19
20
21
22
23
24
25
26
27
28
29
30
31
32
33
34
35
36
37
38
39
import pandas as pd
import numpy as np
import statsmodels.formula.api as smf

np.random.seed(42)

# Simulate 100 students (2 time periods = 200 rows)
n_students = 100
records = []

for student_id in range(1, n_students + 1):
    is_treatment = 1 if student_id > 50 else 0
    base_skill = np.random.normal(20, 3) # Starting average around 20

    # Pre-test (Time = 0)
    records.append({
        "student_id": student_id, "time": 0, "group": is_treatment,
        "batting_avg": base_skill + np.random.normal(0, 2)
    })

    # Post-test (Time = 1) - Natural time effect is +2. Coach effect is +6.
    coach_effect = 6.0 if is_treatment else 0
    time_effect = 2.0
    records.append({
        "student_id": student_id, "time": 1, "group": is_treatment,
        "batting_avg": base_skill + time_effect + coach_effect + np.random.normal(0, 2)
    })

df_did = pd.DataFrame(records)

# Run DiD Regression.
# Each student contributes TWO rows (pre and post), so the observations are not
# independent. Plain OLS standard errors ignore that and are wrong. We cluster the
# standard errors at the student level, which is the entity assignment lives on.
model_did = smf.ols('batting_avg ~ group * time', data=df_did).fit(
    cov_type='cluster', cov_kwds={'groups': df_did['student_id']})
print(model_did.summary().tables[1])
print(f"\nEstimated Uplift (group:time): {model_did.params['group:time']:.2f} runs")
print(f"P-Value: {model_did.pvalues['group:time']:.4f}")
The point estimate is unchanged by clustering; only its standard error (and therefore the p-value and confidence interval) is corrected. Here the interaction lands at roughly +6.9 runs against a true effect of +6.0, comfortably significant. The gap between 6.9 and 6.0 is ordinary sampling noise in a 100-student draw, a useful reminder that even a correctly specified model returns an estimate, not the parameter.
Bonus: The Power of Covariates (e.g., Age)
Here is arguably the biggest reason Data Scientists prefer regression (OLS) over the vanilla arithmetic method for DiD: Adding Covariates.
Imagine we realize that older kids naturally hit the ball further, regardless of the coach. If we try to calculate the DiD by hand, we’d have to slice our data into tiny, messy buckets (a DiD for 12-year-olds, a DiD for 13-year-olds, etc.) to ensure a fair comparison.
With OLS, we simply add Age to our equation:
\[Y_{it} = \beta_0 + \beta_1(\text{Group}_i) + \beta_2(\text{Time}_t) + \beta_3(\text{Group}_i \times \text{Time}_t) + \beta_4(\text{Age}_i) + \epsilon_{it}\]- $\beta_4$ (Covariate Effect): This new term captures the isolated effect of a student’s age on their batting average.
By adding this, OLS mathematically “holds Age constant.” It figures out exactly how much advantage age provides and subtracts that background noise from everyone’s score. In Python, this is as easy as changing the formula to batting_avg ~ group * time + age.
Two important qualifications, though. First, the precision gain is not automatic: a covariate only tightens the standard error to the extent it actually predicts the outcome. Age that has little bearing on batting average buys us almost nothing, and each added term costs a degree of freedom. When the covariate is predictive (as age plausibly is here), the residual variance shrinks, the points cluster tighter around the trend, and the p-value for $\beta_3$ sharpens. Second, and non-negotiable: only adjust for pre-treatment covariates, variables fixed before the coaching started (age, baseline skill). Adjusting for anything the coach could have changed (say, post-training confidence) is “controlling for a mediator,” and it biases the very effect we are trying to measure.
3. Propensity Score Matching (PSM): Fixing Selection Bias
The Plot Twist: What if we didn’t randomize? What if, out of our 100 total students, the academy owner hand-picked the 25 “most promising” students to train with the Pro?
Now DiD is broken. The Parallel Trends Assumption is dead. Promising students don’t just have higher baseline scores; they learn faster. Their natural time trend is steeper than the average student’s.
The Intuition
To make a fair comparison, we look at the kids left behind and find the statistical “twins” of the ones who were selected: for each treated student we want an untreated student who looked equally likely to be picked.
A word of caution before we get seduced by the word “twins,” because this is where the method is most often oversold. Matching does not recreate a randomized experiment. All it can do is balance the covariates we measured and fed into the model. It rests on three assumptions that, unlike randomization, we cannot verify from the design alone:
- Conditional exchangeability (no unmeasured confounding). Once we condition on the observed covariates, treatment is as good as random. If some unmeasured trait drives both selection and outcome, matching cannot touch it. This is the assumption that fails in the IV section, and it is the whole reason IV exists.
- Overlap (positivity). For the covariate values a treated student has, there must actually exist untreated students with similar values to match against. No comparable controls, no comparison.
- A usefully specified propensity model, and a clearly stated target estimand (here, the ATT).
Under these, matching gives a credible estimate; it never gives a guaranteed one. And note what it does not require: matching is not inherently a cross-sectional trick. It can be layered onto a panel design (match first, then run DiD on the matched sample) when both selection-on-observables and a trend problem are present.
The Mechanism
- Calculate Propensity: Run a Logistic Regression using observable traits (Skill, Motivation, Age) to predict the probability (0.0 to 1.0) of a student being selected for the camp.
- Match (Sequential Matching without Replacement): Now we find the “twins.” We use a greedy, sequential algorithm to pair students up.
- We take the first Treated student and look at their Propensity Score (e.g., 0.85).
- We search the Control group for the student with the closest score (e.g., 0.84) and pair them up.
- Crucially, we then remove that Control student from the available pool. This is called matching without replacement. It ensures that if we have two elite Treated students, they don’t accidentally get matched to the exact same elite Control student.
- We repeat this process until all 25 Treated students have a unique Control partner.
- Discard: Throw away the remaining 50 unmatched control students. They were never promising to begin with, so comparing them to the elite group would introduce selection bias.
- Compare: Calculate the difference in outcomes only among the 25 matched pairs.
Do we need the DiD time-interaction here?
Not in this snapshot version. Our worked example has only a final cross-sectional outcome, not a pre/post panel, so there are no slopes over time to difference. The matching step has (we hope) balanced the observed covariates across the two groups, so the simplest analysis is the Average Treatment effect on the Treated (ATT):
\[\text{ATT} = \bar{Y}_{Treated\_Matched} - \bar{Y}_{Control\_Matched}\]To attach a p-value, we run a standard OLS regression on the matched dataset (outcome ~ treatment):
- $Y_i$ (Outcome): The final batting average for student $i$.
- $\beta_0$ (Intercept): The baseline average score of the matched control group.
- $\beta_1$ (The ATT / True Uplift): This coefficient represents the value added by the coach, and its associated p-value tells us whether that impact is statistically significant.
- $\epsilon_{i}$ (Error Term): The remaining random variance per student.
But “we hope” is doing real work in that paragraph, and we should never just hope. Two disciplines separate credible matching from wishful matching, and we will see both bite in the simulation below:
- Check balance, do not assume it. After matching, compute the standardized mean difference (SMD) for every covariate: the difference in group means divided by the pooled standard deviation. A common rule of thumb is that $\lvert \text{SMD} \rvert < 0.1$ is “well balanced.” Matching on a single scalar (the propensity score) often leaves residual imbalance on the individual covariates, because two students with the same probability of selection can still differ in the underlying traits.
- Adjust for what balance leaves behind. The robust practical recipe is to both match and regress the outcome on treatment plus the covariates on the matched set (
outcome ~ treatment + skill + motivation). Matching handles the gross imbalance and restricts us to the region of overlap; the regression mops up the residual. This “match then adjust” combination is far more reliable than trusting either step alone.
PSM Python Simulation
A quick note on scale before the code. With only 25 treated kids, no estimator on earth can cleanly separate a +5 signal from the noise of two dozen students, so a “PSM on 25 kids” demo would teach us nothing except that small samples are noisy. To watch the estimator’s behaviour (and its failure modes) we simulate a larger academy of 2,000 students. The lesson transfers straight back to the 25-kid intuition.
The confounders skill and motivation drive both selection and outcome, which is exactly the selection-bias setup. Because they are fully observed, conditional exchangeability holds by construction here, so a correct method should recover the true +5.0 effect. Watch which methods do.
1
2
3
4
5
6
7
8
9
10
11
12
13
14
15
16
17
18
19
20
21
22
23
24
25
26
27
28
29
30
31
32
33
34
35
36
37
38
39
40
41
42
43
44
45
46
47
48
49
50
51
52
53
54
55
56
57
58
59
60
61
62
63
64
65
66
67
import numpy as np, pandas as pd
import statsmodels.formula.api as smf
from sklearn.linear_model import LogisticRegression

rng = np.random.RandomState(7)
n = 2000

# Two confounders that drive BOTH selection and outcome
skill      = rng.normal(50, 15, n)
motivation = rng.normal(5, 2, n)

# The owner favours skilled, motivated kids, but overlapping (not deterministic)
z = 1.5 * ((skill - 50) / 15 + (motivation - 5) / 2)
z -= z.mean()                       # centre so roughly half are selected
treatment = rng.binomial(1, 1 / (1 + np.exp(-z)))

# TRUE coaching effect is +5.0 runs
outcome = 0.5 * skill + 2.0 * motivation + 5.0 * treatment + rng.normal(0, 2, n)

df = pd.DataFrame({'skill': skill, 'motivation': motivation,
                   'treatment': treatment, 'outcome': outcome})

# --- Naive comparison: badly biased by selection ---
naive = df[df.treatment == 1].outcome.mean() - df[df.treatment == 0].outcome.mean()
print(f"Naive difference           : {naive:.2f} runs   (badly biased)")   # ~14.6

# --- 1. Propensity model on the OBSERVED confounders ---
lr = LogisticRegression()
df['ps'] = lr.fit(df[['skill', 'motivation']], df.treatment).predict_proba(
    df[['skill', 'motivation']])[:, 1]
df['logit_ps'] = np.log(df.ps / (1 - df.ps))

# --- Balance diagnostic: standardized mean difference ---
def smd(idx_t, idx_c, col):
    t, c = df.loc[idx_t, col], df.loc[idx_c, col]
    return (t.mean() - c.mean()) / np.sqrt((t.var() + c.var()) / 2)

t_all = df.index[df.treatment == 1]; c_all = df.index[df.treatment == 0]
print(f"SMD before  skill={smd(t_all, c_all,'skill'):+.2f}  "
      f"motivation={smd(t_all, c_all,'motivation'):+.2f}")           # ~ +0.9 each

# --- 2. Greedy 1:1 matching WITHOUT replacement, with a caliper ---
caliper = 0.2 * df.logit_ps.std()          # reject matches farther than this
treated = df[df.treatment == 1]
avail   = df[df.treatment == 0].copy()
t_idx, c_idx = [], []
for i, row in treated.sort_values('ps', ascending=False).iterrows():
    if avail.empty:
        break
    d = (avail.logit_ps - row.logit_ps).abs()
    j = d.idxmin()
    if d[j] > caliper:                     # no control close enough -> discard
        continue
    t_idx.append(i); c_idx.append(j); avail = avail.drop(j)

n_discarded = int(df.treatment.sum()) - len(t_idx)
print(f"Matched {len(t_idx)} pairs; discarded {n_discarded} treated with no match in support")
print(f"SMD after   skill={smd(t_idx, c_idx,'skill'):+.2f}  "
      f"motivation={smd(t_idx, c_idx,'motivation'):+.2f}")           # ~ +0.1 each

matched = df.loc[t_idx + c_idx]

# --- 3. ATT: matching alone vs. matching + covariate adjustment ---
att_match  = smf.ols('outcome ~ treatment', data=matched).fit()
att_adjust = smf.ols('outcome ~ treatment + skill + motivation', data=matched).fit()
print(f"ATT, matching only         : {att_match.params['treatment']:.2f} runs   (still biased)")
print(f"ATT, matching + adjustment : {att_adjust.params['treatment']:.2f} runs   (true is 5.0)")
Running this prints roughly:
1
2
3
4
5
6
Naive difference           : 14.59 runs   (badly biased)
SMD before  skill=+0.93  motivation=+0.91
Matched 518 pairs; discarded 476 treated with no match in support
SMD after   skill=+0.15  motivation=+0.10
ATT, matching only         : 6.24 runs   (still biased)
ATT, matching + adjustment : 5.01 runs   (true is 5.0)
There is a lot to learn from those five lines, and most of it is cautionary:
- The naive gap (14.6) is almost triple the truth (5.0). Selection, not coaching, accounts for the bulk of it: the picked kids were already more skilled and motivated. This is the whole problem in one number.
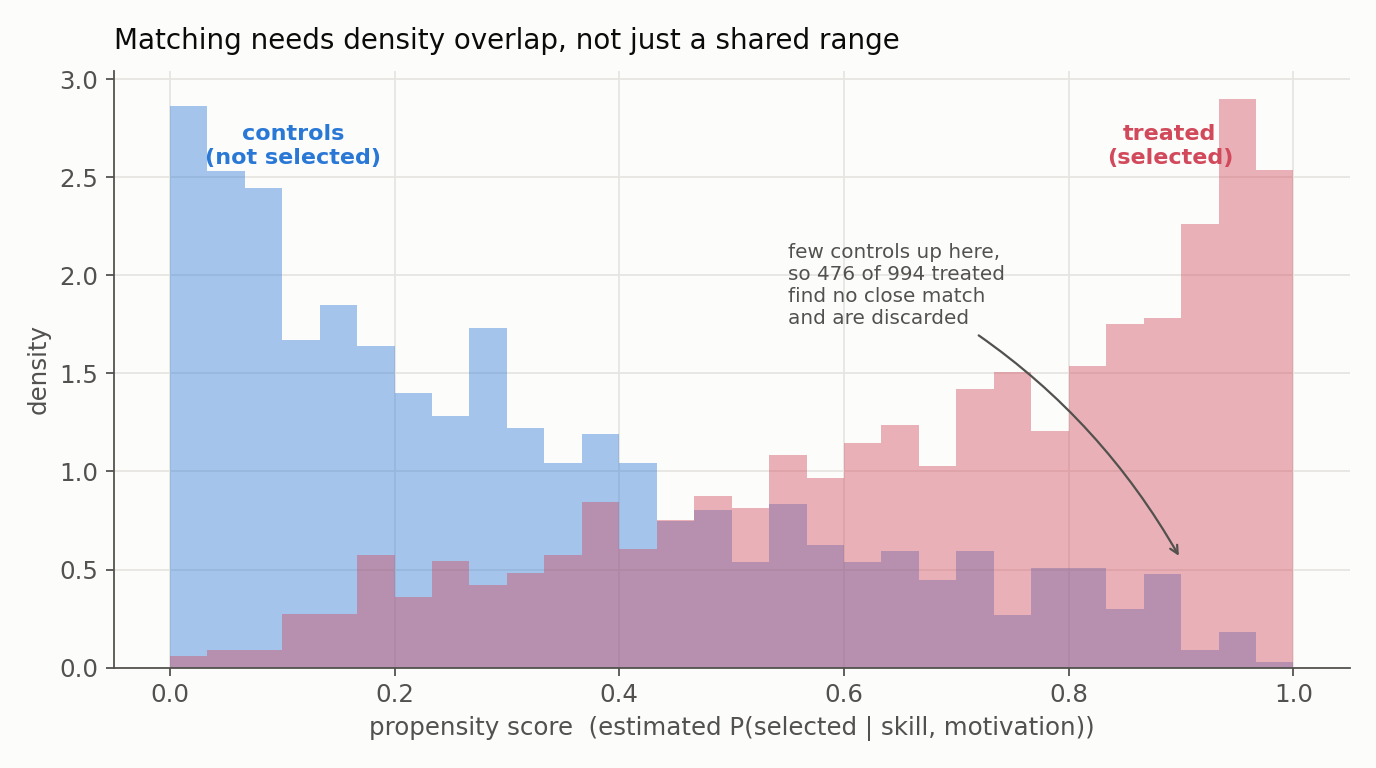
- Matching restricts us to the region of overlap, and that is expensive. Of the 994 treated students, 476 (nearly half) had no control close enough within the caliper and were discarded. That is not a bug to be silenced; it is the method honestly reporting that for those students there is no credible comparison in the data. It also quietly changes the estimand: we now estimate the ATT on the matched, common-support region, not on all treated kids.
- Matching alone still leaves bias (6.24 vs 5.0). The SMDs fell from ~0.9 to ~0.1, a big improvement, but not to zero. Balancing the scalar propensity score did not fully balance the two underlying covariates, so a residual gap remains.
- Match then adjust recovers the truth (5.01). Adding
skillandmotivationback into the outcome regression on the matched set cleans up the residual imbalance. This is why serious practice pairs matching with regression rather than trusting the raw matched difference.
The propensity-score histogram makes the overlap problem visible, and shows why the discards happen:
A final honesty note. Propensity-score matching is not always the best tool for this job, and can even increase imbalance in some regimes by pruning data haphazardly, a critique made forcefully by King and Nielsen (2019). Weighting or direct covariate adjustment is often preferable. And none of it rescues us from the one failure matching cannot see: an unobserved confounder. That is exactly the wall we hit next.
4. Instrumental Variables (IV): The Heavy Artillery
The Final Plot Twist: The academy decides the Pro coach is an optional, paid add-on. Parents must opt-in and pay extra.
We now have Unobserved Confounding. Parents who pay for the coach might also be highly motivated parents who buy their kids better diets, personal batting cages, and top-tier gear.
- We cannot use DiD because parallel trends are broken by this underlying parental wealth/motivation.
- We cannot use PSM because we suffer from Unobserved Confounding. PSM has a strict mathematical rule: we cannot match on what we cannot measure. If we try to match a Treated student and a Control student based only on their visible traits (like Skill and Age), we might inadvertently pair a kid with highly involved, wealthy parents against a kid without that invisible support system. They might look like statistical “twins” on our spreadsheet, but the hidden wealth factor gives the Treated kid an invisible advantage (better diet, expensive bats, weekend games). We are matching apples to oranges without realizing it, meaning the selection bias remains completely intact.
The Intuition
We need an Instrument ($Z$): A random event that “pushes” kids into getting the coach ($X$) but has absolutely zero direct effect on their Batting Average ($Y$). The Instrument: A promotional lottery. We randomly give 50 kids a “50% Off” voucher for the Pro coach.
What IV Assumes, and What It Actually Estimates
For the voucher to be a valid instrument, four assumptions must all hold, and only the first is checkable from the data:
- Relevance. The voucher genuinely moves coaching uptake. This one we can test: run the first stage and look at the instrument’s strength (a first-stage F-statistic well above the usual rule-of-thumb of 10). A weak instrument makes IV estimates wildly unstable and biased.
- Independence (exogeneity). The voucher is assigned as-if at random with respect to the students’ potential outcomes. Our lottery buys this by construction; an instrument that people select into would not.
- Exclusion restriction. The voucher affects batting average only through the coaching, never directly. This is an untestable judgement call and the place IV most often breaks. Is it really true here? A voucher is money: a family that wins one keeps cash that might buy a better bat, extra nets, or simply signals that “someone believes in my kid.” Any such channel violates exclusion and quietly biases the estimate. We must argue for exclusion; the data cannot confirm it.
- Monotonicity. The voucher only ever nudges families toward coaching, never away. No “defiers” who would have hired the coach but refuse precisely because they won a discount.
Under these four, IV does not recover the average effect for everyone. It recovers a Local Average Treatment Effect (LATE): the effect specifically among compliers, the families who hired the coach because they won the voucher and would not have otherwise. It says nothing about “always-takers” (wealthy families who would hire the coach regardless) or “never-takers.” So the honest one-line summary of our result is not “the effect of coaching,” nor even “the effect on kids who got coached,” but “the effect of coaching among the families whose decision the voucher actually flipped.” Whether that subgroup is the one we care about is a question the statistics cannot answer for us.
The Mechanism (Two-Stage Least Squares - 2SLS)
We use the random voucher to extract the “clean” variation in coaching through two consecutive regression equations. (Note: We use standard Linear Regression (OLS) for both stages to prevent a mathematical trap called the “Forbidden Regression,” ensuring our math stays unbiased even though Coach_Hired is binary).
Stage 1: The “Clean” Push
Objective: Figure out exactly how much the random voucher ($Z$) influences a student’s likelihood of hiring the coach ($X$), ignoring everything else.
\[\text{Coach\_Hired}_i = \alpha_0 + \alpha_1(\text{Voucher}_i) + u_i\]Let’s look at a concrete example. Suppose out of the 50 kids who didn’t get the voucher, 10 of them (20%) had wealthy/motivated parents who paid full price for the coach anyway. But out of the 50 kids who did win the voucher, 35 of them (70%) hired the coach.
- The base rate ($\alpha_0$) is 0.20 (20%).
- The voucher effect ($\alpha_1$) is 0.50 (70% - 20%). The voucher successfully “pushed” an extra 50% of kids into getting coaching!
Instead of returning a simple 1 or 0, this Stage 1 equation generates a Predicted Probability ($\hat{X}$) for every kid:
- Losers get a “clean” score of 0.20
- Winners get a “clean” score of 0.70
This $\hat{X}$ value is pure. It is completely stripped of “parental wealth” bias because it was derived 100% from the random lottery results.
Stage 2: The True Effect
Objective: Calculate how this pure, clean variation ($\hat{X}$) affects the final Batting Average ($Y$).
\[\text{Batting\_Average}_i = \beta_0 + \beta_{IV}(\hat{X}_i) + \epsilon_i\]Let’s say the average batting score for the Lottery Losers (our 0.20 bucket) is 20 runs. The average score for the Lottery Winners (our 0.70 bucket) is 24 runs.
The math calculates the slope: How much did the Batting Average jump when the clean probability jumped?
- Change in Outcome ($Y$) = 24 - 20 = +4.0 runs
- Change in Probability ($\hat{X}$) = 0.70 - 0.20 = 0.50
The Intuition Check: We saw a raw +4.0 run improvement across the whole winning group. But we know the voucher only swayed 50% of the group to actually take action. Therefore, the effect among the kids the voucher moved (the compliers) must have been double (+8.0 runs) to account for the fact that the other half of the winners, who would not have hired the coach either way, diluted the average. Note the careful wording: this +8.0 is the LATE for compliers, not the effect for the always-takers who would have hired the coach with or without a discount. This ratio (change in outcome divided by change in uptake) is the Wald estimator, the simplest form of IV.
IV Python Simulation
As with matching, we simulate a larger cohort (5,000 students) so the bias and its correction are visible rather than buried in small-sample noise. We will show the manual two stages first to make the mechanics concrete, then the correct way to actually run it. The manual version gets the point estimate right but its second-stage standard errors are wrong: stage 2 treats $\hat{X}$ as if it were ordinary data, ignoring that it was itself estimated in stage 1, so the reported uncertainty is too small. A purpose-built IV estimator propagates that uncertainty properly, which is why production code should never hand-roll the two stages.
1
2
3
4
5
6
7
8
9
10
11
12
13
14
15
16
17
18
19
20
21
22
23
24
25
26
27
28
29
30
31
32
import numpy as np, pandas as pd
import statsmodels.formula.api as smf

np.random.seed(3)
n = 5000

# 1. The UNOBSERVED confounder (parental wealth/involvement) - we never measure this
unobserved_wealth = np.random.normal(0, 1, n)

# 2. The instrument: a random 50%-off voucher (independent of wealth by design)
voucher_Z = np.random.binomial(1, 0.5, n)

# 3. Coaching uptake depends on BOTH the voucher (the push) and hidden wealth
#    intercept/slope tuned so ~20% of losers and ~70% of winners take the coach
coach_prob = -1.386 + 2.23 * voucher_Z + 1.0 * unobserved_wealth
coach_X = np.random.binomial(1, 1 / (1 + np.exp(-coach_prob)))

# 4. Outcome depends on coaching (+8.0 TRUE effect) and the hidden wealth
batting_Y = 20 + 8.0 * coach_X + 4.0 * unobserved_wealth + np.random.normal(0, 3, n)

df_iv = pd.DataFrame({'voucher': voucher_Z, 'coach': coach_X, 'outcome': batting_Y})

# Naive regression: biased UPWARD, because wealthy families both take the coach and score higher
naive = smf.ols('outcome ~ coach', data=df_iv).fit()
print(f"Naive estimate (biased): {naive.params['coach']:.2f}")            # ~10.6

# --- Manual 2SLS: correct POINT estimate, WRONG standard errors ---
stage1 = smf.ols('coach ~ voucher', data=df_iv).fit()
print(f"First-stage voucher coef: {stage1.params['voucher']:.2f}  F: {stage1.fvalue:.0f}")
df_iv['coach_hat'] = stage1.predict()
stage2 = smf.ols('outcome ~ coach_hat', data=df_iv).fit()
print(f"Manual 2SLS point estimate: {stage2.params['coach_hat']:.2f}  (true is 8.0)")  # ~8.1
This prints a naive estimate of about 10.6, biased clearly upward: wealthier, more involved families both buy the coaching and produce higher scores anyway, so the raw comparison hands the coach credit for the wealth. The first-stage F is enormous (well over 1,000, so the voucher is a very strong instrument), and the 2SLS point estimate is about 8.1, right on the true 8.0. IV strips out the wealth channel that matching could never have seen. The point estimate is trustworthy; the stage-2 standard error printed by that last regression is not.
For real work, use a dedicated IV routine that returns valid standard errors and first-stage diagnostics in one shot:
1
2
3
4
5
6
# pip install linearmodels
from linearmodels.iv import IV2SLS

iv = IV2SLS.from_formula('outcome ~ 1 + [coach ~ voucher]', data=df_iv).fit()
print(iv.params['coach'], iv.std_errors['coach'])   # ~8.1, with a VALID standard error
print(iv.first_stage.diagnostics)                    # first-stage F, partial R-squared, etc.
The point estimate matches the manual version (about 8.1), but now the standard error is computed correctly (here about 0.3, so the effect is overwhelmingly significant). The first_stage diagnostics report instrument strength, the single most important thing to check before trusting any IV result.
Conclusion
A/B testing is the gold standard, but data scientists rarely work in perfectly controlled laboratories. The three methods here are the workhorses for when randomization is missing:
- If we have grouped pre/post data and can defend parallel trends, use DiD.
- If we have selection bias but genuinely recorded all the confounders, match (and then adjust).
- If we have unmeasured confounding but can find a clever randomized “nudge,” use Instrumental Variables.
The single most important thing to carry away is that these three are not interchangeable. Each answers a subtly different question, under a different load-bearing assumption, and each is falsifiable in a different way. It helps to see them side by side:
| Method | What it estimates | Key comparison | Assumption doing the causal work | How it fails / what to check |
|---|---|---|---|---|
| Randomized A/B test | ATE (or ITT) for eligible units | Randomly assigned groups | Known random assignment | SRM, non-compliance, interference |
| DiD | ATT / group-time effect | Change in treated vs untreated over time | Parallel untreated trends | Event-study pre-trends; staggered timing |
| Matching / weighting | ATT or ATE (by construction) | Units with comparable observed covariates | No unmeasured confounding + overlap | Balance (SMD), overlap plot, discards |
| IV (2SLS) | LATE for compliers | Outcome shift induced by the instrument | Relevance, independence, exclusion, monotonicity | First-stage F; defend exclusion |
And a note on what none of these solve. They are identification strategies, not magic. DiD cannot save us if a shock hits one group alone; matching is blind to any confounder we failed to measure; IV needs an instrument we can defend on substantive, not statistical, grounds, and even then speaks only for the compliers. When the assumptions are not credible, the right answer is often “this question cannot be answered with this data,” and saying so is a feature of good causal thinking, not a failure of it.
Where this leads. Every method in this post asks a backward-looking, causal question: given what happened, what was the effect of the intervention? The next post on multi-armed bandits asks a different, forward-looking one: while we are still learning, how should we allocate the next visitor’s traffic to earn the most reward? Adaptive allocation is a powerful tool, but it is worth being clear from the outset that it is an optimization strategy, not a shortcut around the identification problems we have just spent this whole post taking seriously.
Resources
- Imbens, G. W. & Rubin, D. B. (2015). Causal Inference for Statistics, Social, and Biomedical Sciences. Cambridge University Press.
- Angrist, J. D. & Pischke, J.-S. (2009). Mostly Harmless Econometrics: An Empiricist’s Companion. Princeton University Press.
- Callaway, B. & Sant’Anna, P. H. C. (2021). Difference-in-Differences with Multiple Time Periods. Journal of Econometrics, 225(2), 200-230.
- King, G. & Nielsen, R. (2019). Why Propensity Scores Should Not Be Used for Matching. Political Analysis, 27(4), 435-454.
Continue to multi-armed bandits, or revisit designing a trustworthy A/B test.