Beyond Traditional A/B Testing: Multi-Armed and Contextual Bandits
Multi-armed and contextual bandits as adaptive decision-making: the explore-exploit trade-off, ε-greedy, UCB, and Thompson sampling, and the inference and safety costs that adaptive traffic allocation quietly introduces.
Part of the statistical-inference arc. It builds on designing a trustworthy A/B test, sample size and stopping rules, and causal inference, and is followed by a short GLM epilogue.
Welcome to the last major installment of our A/B Testing series (a short epilogue on generalized linear models follows). Over the past several posts, we’ve covered the entire statistical foundation of experimentation - from p-values, confidence intervals, and z/t-tests to ANOVA, Chi-Square tests, sample size calculations, and even advanced causal inference methods like DiD, PSM, and IV.
Having followed along, we are now equipped to design and analyze rigorous, robust A/B tests. But today, we are going to change the objective itself. We are moving from the static world of estimating an effect into the dynamic, continuous learning environment where the goal is to maximize reward while we learn.
Today, we dive into Multi-Armed Bandits (MAB).
1. MAB: Optimizing for Reward, Not Just Estimating an Effect
In a traditional fixed-horizon A/B test, we follow a strict sequence:
- Allocate traffic (e.g., 50/50) between variants.
- Wait until the pre-specified sample size is reached - the fixed horizon we powered the test for. (We do not stop the first moment a p-value dips below 0.05; that is peeking, which inflates false positives. A valid early stop needs a sequential test.)
- Measure the results and declare a winner.
- Exploit the winner by routing 100% of future traffic to it.
The cost? During the “Wait” phase, we are intentionally sending half of our users to what may be an inferior experience: lost conversions and lost revenue.
It is tempting to call a bandit a “better A/B test,” but that hides the real distinction: a bandit optimizes a different objective. An A/B test estimates an effect with interpretable uncertainty; a bandit maximizes cumulative reward while it learns - and, as the later sections show, makes clean inference much harder to recover. Different tools for different questions:
| Goal | Better starting design |
|---|---|
| Estimate a stable causal effect with interpretable uncertainty | Randomized A/B test |
| Identify the single best arm after a fixed budget | Best-arm identification |
| Maximize cumulative reward during learning | Multi-armed bandit |
| Personalize the action to each user’s context | Contextual bandit |
Multi-Armed Bandits (MAB) solve this via the Explore-Exploit dilemma. Instead of waiting for a test to finish, a bandit algorithm continuously adjusts traffic while it learns. If Variant B starts looking better, the bandit smoothly sends more traffic to B, while occasionally checking Variant A just to be sure.
The Benefits:
- Faster Value Realization: We start exploiting the winning variant almost immediately.
- Minimized Regret: We lose fewer conversions on bad variations.
- Continuous Operation: A bandit keeps running instead of ending on a fixed date, which suits settings where declaring a winner once and freezing is awkward (news feeds, ad rotation). One caveat, though: the basic algorithms here assume each arm’s reward rate is stationary (fixed over time). A genuinely drifting environment is not handled for free; it needs extra machinery (sliding windows, discounting, change-point detection), or a vanilla bandit will lock onto yesterday’s winner. We return to this in the extensions.
The Origin: Why “Multi-Armed Bandits”?
If the quirky name is puzzling, it comes straight from the casino floor. A standard casino slot machine is colloquially known as a “one-armed bandit” (because it has one lever, or “arm”, to pull - and it reliably robs us of our money).
Imagine we are standing in front of a row of multiple slot machines - a multi-armed bandit. Each machine has a different, unknown probability of paying out. We have a limited bucket of tokens, and our goal is to maximize our total winnings.
To do this, we must continually balance two actions:
- Exploration: Pulling different levers to figure out which machine has the highest payout rate.
- Exploitation: Pulling the lever of the best machine we’ve found so far to rake in the money.
The Connection to A/B Testing: In our software and marketing context, the analogy maps perfectly:
- An “Arm” is a test variant (e.g., Ad A, Ad B, Landing Page C).
- “Pulling an arm” means routing a user to that specific variant.
- The “Payout” (or reward) is the desired business action - a click, a sign-up, or a purchase.
A bandit algorithm’s job is to play this metaphorical casino perfectly: figuring out the winning variant while sacrificing as little traffic as possible to the losing ones.
2. Solving the Dilemma: The Baseline, Regret, and Advanced Philosophies
Before jumping into the advanced algorithms that rule the industry, let’s look at the simplest way to solve the explore-exploit dilemma.
The Baseline: $\epsilon$-Greedy Strategy
Imagine we decide to explore randomly a fixed percentage of the time. We pick a small fraction, $\epsilon$ (epsilon), say 10% or 0.10.
- 90% of the time (Exploit): We show the ad that currently has the highest historical CTR.
- 10% of the time (Explore): We show a completely random ad to see if we can gather more data.
It is incredibly simple to implement. However, it has a major flaw: it explores blindly. Even after 10,000 trials when we are 99.9% sure Ad B is the winner, $\epsilon$-Greedy will still stubbornly send 10% of our traffic to losing ads. It never stops wasting money.
Measuring Success: What is “Regret”?
To evaluate how bad that “wasted money” is, Data Scientists use a metric called Regret. Regret is the difference in cumulative reward between a perfect oracle (someone who magically knew the absolute best ad from day one and only played that arm) and our algorithm.
\[\text{Regret}(T) = \sum_{t=1}^T (\mu^* - \mu_{a_t})\]Where:
- $T$: The total number of trials (e.g., total ad impressions).
- $t$: The current step or trial we are evaluating.
- $\mu^*$: The true reward rate (e.g., true CTR) of the absolute best possible ad.
- $\mu_{a_t}$: The true reward rate of the ad our algorithm actually chose at step $t$.
In plain English: At every single step, we calculate how much worse our choice was compared to the perfect choice ($\mu^* - \mu_{a_t}$). We then add up all these “missed opportunities” over time to get our total Regret.
- Because $\epsilon$-greedy with a fixed $\epsilon$ never stops exploring blindly, its Regret grows continuously at a steady rate forever. We call this Linear Regret ($O(\epsilon T)$). (This is specific to the constant-$\epsilon$ version; a decaying $\epsilon$ schedule that shrinks toward zero over time can behave much better.)
- Our goal is to find algorithms that get smarter over time, exploring less as they become more confident. This causes the Regret curve to flatten out, achieving sub-linear, typically Logarithmic Regret ($O(\log T)$). These guarantees are not unconditional: they assume a stationary stochastic model with bounded rewards, and the actual constant depends on the algorithm variant, the gaps between arms, and (for Thompson sampling) the prior.
Two Advanced Philosophies
How do we achieve this flattening regret curve? We need algorithms that explore intelligently based on uncertainty, rather than relying on a blind coin flip.
Two dominant algorithms rule the industry, representing two fundamental statistical philosophies:
- Thompson Sampling (The Bayesian View): Models uncertainty using probability distributions. It relies on updating prior beliefs with new evidence to form a posterior distribution.
- Upper Confidence Bound or UCB (The Frequentist View): Focuses on deterministic confidence intervals. It uses hard bounds and statistical concentration inequalities to guarantee worst-case performance.
Let’s explore both.
3. Thompson Sampling: The Probabilistic Approach
3.a) Intuition with an Ad Campaign Example
Imagine we’re running an ad campaign with three different ad creatives: Ad A, Ad B, and Ad C. We want to maximize our Click-Through Rate (CTR).
Instead of just tracking the flat CTR, Thompson Sampling models each ad’s “true” CTR as a probability distribution.
- At step 1 (no data), these distributions are wide and flat (we are uncertain).
- For every new user, the algorithm draws one random sample from each ad’s distribution.
- Suppose the draws are: Ad A = 0.045, Ad B = 0.051, Ad C = 0.039.
- Ad B wins! We show Ad B to the user.
- If the user clicks (success), Ad B’s distribution shifts to the right and gets slightly narrower (we are more confident). If they don’t click, it shifts left.
Over time, the distribution for the truly best ad will shift right and become narrow. Because it occupies the highest probability space, it naturally “wins” the sampling process more often, smoothly transitioning the algorithm from exploration to exploitation.
3.b) Math Formulation & The Beta Distribution
Because click-through rates are probabilities (bounded between 0 and 1), we model our beliefs using the Beta distribution.
A Beta distribution is parameterized by two values: $\alpha$ (successes) and $\beta$ (failures).
\[f(x; \alpha, \beta) \propto x^{\alpha-1}(1-x)^{\beta-1}\]As we accumulate more clicks ($\alpha$) and non-clicks ($\beta$), the distribution updates continuously.
3.c) The Beta-Bernoulli Posterior Update (and Why It Is Not MAP)
The iterative refinement of the Beta distribution in Thompson Sampling is a direct, online application of Bayesian posterior updating. Each observed click or non-click updates a posterior belief about the arm’s true CTR through Bayes’ rule:
\[P(\text{parameter} \mid \text{data}) \propto P(\text{data} \mid \text{parameter}) \cdot P(\text{parameter})\]Let’s derive the Beta-Bernoulli bridge:
- Prior: $P(p) \propto p^{\alpha - 1} (1-p)^{\beta - 1}$
- Likelihood (Bernoulli trial): We observe outcome $x$ (1 for click, 0 for no click). $P(x \vert p) = p^x (1-p)^{1-x}$
- Posterior: $P(p \vert x) \propto [p^x (1-p)^{1-x}] \cdot [p^{\alpha - 1} (1-p)^{\beta - 1}]$
Combining terms by adding exponents gives us:
\[P(p | x) \propto p^{(\alpha + x) - 1} (1-p)^{(\beta + 1 - x) - 1}\]This is exactly a new Beta distribution with parameters $\alpha’ = \alpha + x$ and $\beta’ = \beta + 1 - x$. Concretely, a click sends $\alpha \to \alpha + 1$ and a non-click sends $\beta \to \beta + 1$: prior counts plus observed successes and failures.
A common but important error is to call this MAP estimation. Maximum A Posteriori estimation would collapse this posterior to a single number, its mode (the peak). Thompson Sampling does the opposite of collapsing: for each decision it draws a random sample from the entire posterior and acts on that draw. That distinction is not a technicality, it is the exploration mechanism. A MAP-style policy that always played the arm with the highest posterior mode would stop exploring the instant one arm edged ahead and could lock onto a false winner forever. By sampling from the full posterior, a wide (uncertain) distribution occasionally produces a high draw and earns another look, while a narrow (confident) one rarely does. Thompson Sampling is posterior sampling, not posterior maximization.
3.d) Why the Beta Distribution? (Conjugate Priors)
Why use Beta and not a Normal distribution?
- Boundedness: Normal distributions span to infinity; probabilities cannot exceed $[0, 1]$.
- Conjugacy: The Beta distribution is the conjugate prior for the Bernoulli distribution. When we multiply a Beta prior by a Bernoulli likelihood, the posterior is guaranteed to remain a Beta distribution. This conjugacy turns a complex Bayesian integration problem into simple addition (just add 1 to $\alpha$ or $\beta$).
3.e) Injecting Business Logic via Specific Priors
One of the absolute superpowers of Thompson Sampling (and Bayesian methods in general) is the ability to easily inject domain knowledge or historical data into the algorithm before it even starts.
When we initialize a Bandit with $\alpha=1$ and $\beta=1$, we get $\text{Beta}(1,1)$, which is exactly the uniform distribution: a perfectly flat belief that treats a 99% CTR as just as likely as a 1% CTR. It is commonly called “uninformative,” though that label is loose - a flat prior on the CTR is still a definite (and sometimes inconvenient) assumption. As a business, we know a 99% CTR is impossible, so we often prefer a prior that says so.
A Concrete Example: The Legacy Baseline
Imagine we are testing a brand new checkout button (Variant B) against our legacy button (Variant A).
- Variant A (Legacy): This button has been on our site for a year. We know from millions of interactions that its conversion rate is exactly 5%. Instead of making the algorithm learn this from scratch, we give it a strong prior: $\alpha=5000$, $\beta=95000$. This creates a massive, narrow spike exactly at 5% on day zero.
- Variant B (New): We have no data for this new button, but we know our industry average is around 4%. We give it a weak prior: $\alpha=4$, $\beta=96$. This centers the belief at 4%, but keeps the distribution relatively wide and uncertain.
The Impact: Because Variant A’s distribution is so dense and historically confident, Variant B won’t accidentally steal 100% of our traffic just because it got two lucky clicks in its first five trials. Variant B has to consistently prove its true mean is higher than 5% over hundreds of trials to shift its distribution past the massive “gravity” of the legacy prior. This allows us to explore new ideas while strictly protecting our baseline revenue.
A caution on strong priors: effective sample size. A prior of $\text{Beta}(5000, 95000)$ is not a mild nudge; it carries $\alpha + \beta = 100{,}000$ pseudo-observations of built-in evidence. That effective sample size means real data must accumulate on the order of 100k trials before it can move the belief. That protects a well-established baseline, but it is a liability if the “known” 5% rate is stale (seasonality, a redesign): the bandit clings to an outdated belief long after it stopped being true. Any strong prior deserves a sensitivity check against a weaker one.
3.f) Python Implementation
1
2
3
4
5
6
7
8
9
10
11
12
13
14
15
16
17
18
19
20
21
22
23
24
25
26
27
28
29
30
31
32
33
34
35
36
37
38
39
40
41
42
43
44
45
46
47
48
49
50
51
52
53
54
55
56
57
58
59
60
61
62
63
64
65
66
67
68
69
70
71
72
73
74
75
76
77
78
79
80
81
82
83
84
85
86
87
88
89
90
91
92
import numpy as np
import matplotlib.pyplot as plt
import seaborn as sns
from scipy.stats import beta

# Set seaborn style for better visuals
sns.set_theme(style="whitegrid")

class ThompsonSampling:
    def __init__(self, n_arms):
        self.n_arms = n_arms
        self.alpha = np.ones(n_arms) # Prior successes = 1
        self.beta = np.ones(n_arms)  # Prior failures = 1

    def select_arm(self):
        # Sample from each beta distribution
        samples = [np.random.beta(self.alpha[i], self.beta[i]) for i in range(self.n_arms)]
        return np.argmax(samples)

    def update(self, arm, reward):
        # Update conjugate prior
        if reward == 1:
            self.alpha[arm] += 1
        else:
            self.beta[arm] += 1

# 1. Setup Use Case: 3 Ads with unknown true CTRs
# Let's assume Ad B is the best performing ad in reality.
ad_names = ['Ad A', 'Ad B', 'Ad C']
true_ctrs = [0.04, 0.055, 0.03]
n_arms = len(true_ctrs)

# Initialize the Bandit
bandit = ThompsonSampling(n_arms)

# Capture initial state parameters to plot the priors later
initial_alpha = bandit.alpha.copy()
initial_beta = bandit.beta.copy()

# 2. Define simulation parameters and termination criteria
# We will run the simulation for a fixed budget of 10,000 impressions.
# (In practice, termination could also be based on the beta distribution's variance shrinking below a threshold)
n_trials = 10000

# 3. Run the simulation
for step in range(n_trials):
    # Step 1: Bandit selects the best ad to show based on current probabilistic beliefs
    chosen_arm = bandit.select_arm()

    # Step 2: Simulate user behavior (Click = 1, No Click = 0)
    # We use a random float between 0 and 1 against the true CTR
    reward = 1 if np.random.rand() < true_ctrs[chosen_arm] else 0

    # Step 3: Bandit updates its internal Beta distribution for the chosen ad
    bandit.update(chosen_arm, reward)

# Output simulation results
impressions = bandit.alpha + bandit.beta - 2 # Subtracting the 1s from our prior
estimated_ctrs = bandit.alpha / (bandit.alpha + bandit.beta)

print(f"Total Impressions: {n_trials}")
for i in range(n_arms):
    print(f"{ad_names[i]} - Shown: {int(impressions[i])} times | Estimated CTR: {estimated_ctrs[i]:.4f} (True: {true_ctrs[i]:.4f})")

# 4. Plot the initial and final Beta distributions using Seaborn
plt.figure(figsize=(10, 6))
x = np.linspace(0, 0.1, 500) # Plotting x-axis from 0% to 10% CTR
colors = sns.color_palette() # Grab default color palette for consistent colors

# Plot Initial Distributions (The Priors)
for i in range(n_arms):
    y_initial = beta.pdf(x, initial_alpha[i], initial_beta[i])
    # Note: Beta(1,1) is uniform, so this will be a flat line at y=1 showing complete uncertainty
    sns.lineplot(x=x, y=y_initial, color=colors[i], linestyle=':', linewidth=1.5, alpha=0.8)

# Add a single dummy line for the initial legend to avoid clustering with 3 identical labels
plt.plot([], [], color='gray', linestyle=':', linewidth=1.5, label='Initial Prior (Uniform Uncertainty)')

# Plot Final Distributions (The Posteriors)
for i in range(n_arms):
    # Calculate the Probability Density Function (PDF) using the final alpha and beta
    y_final = beta.pdf(x, bandit.alpha[i], bandit.beta[i])

    # Plot the updated knowledge using seaborn
    sns.lineplot(x=x, y=y_final, color=colors[i], label=f'{ad_names[i]} (Estimated CTR: {estimated_ctrs[i]:.2%})', linewidth=2.5)

plt.title('Beta Distributions of Ad CTRs: Initial vs. After 10,000 Trials', fontsize=16, pad=15)
plt.xlabel('Click-Through Rate (CTR)', fontsize=14)
plt.ylabel('Density (Certainty)', fontsize=14)
plt.legend(fontsize=12)
plt.tight_layout()
plt.show()
4. Upper Confidence Bound (UCB)
4.a) High-Level Intuition (Ad Campaign)
Let’s return to our Ad A, B, and C campaign, but look through a Frequentist lens.
UCB solves the explore-exploit dilemma with the philosophy of “Optimism under uncertainty.” Suppose Ad A has an estimated CTR of 5%, and Ad B has an estimated CTR of 4%.
- Ad A has been shown 10,000 times. We are very sure its CTR is exactly 5%.
- Ad B has been shown 10 times. Its estimated CTR is 4%, but its confidence interval stretches from 1% to 15%. UCB says: “Even though Ad A looks better on average, Ad B’s optimistic upper bound (15%) is higher. Let’s give Ad B a chance.” UCB always selects the arm with the highest Upper Confidence Bound.
4.b) Mathematical Formulation
The score for arm $i$ at time $t$ is calculated as:
\[\text{UCB}_i = \underbrace{\hat{\mu}_i}_{\text{Exploitation}} + \underbrace{\sqrt{\frac{2 \ln t}{n_i}}}_{\text{Exploration Bonus}}\]- $\hat{\mu}_i$: Current average reward of arm $i$.
- $n_i$: Number of times arm $i$ was pulled.
- $t$: Total rounds so far.
Why the Logarithm? As $t$ grows, $\ln t$ grows very slowly. This ensures we continue to explore indefinitely, but at a rapidly decaying rate.
Why the Square Root of $n_i$ in the denominator? This connects directly to the statistical concept of Standard Error. In statistics, the variance of a sample mean is proportional to $\frac{1}{n}$, meaning its standard deviation (the standard error) shrinks at a rate of $\frac{1}{\sqrt{n}}$. The UCB exploration bonus mimics this exact behavior. As we gather more data for a specific arm ($n_i$ increases), the variance of our estimate drops, causing the uncertainty bonus to shrink proportionally.
4.c) Where Does the Bonus Formula Come From? (Deriving via Hoeffding’s Inequality)
We know the bonus acts like a standard error, but where do the exact terms inside the square root come from? To calculate the precise size of our uncertainty bounds, we need a mathematical guarantee.
In traditional statistics, calculating confidence intervals requires knowing (or estimating) the exact variance ($\sigma^2$). But in an online bandit setting, we want a strict, worst-case guarantee without making assumptions about the underlying variance.
Enter Hoeffding’s Inequality. Hoeffding’s inequality provides a strict mathematical bound for random variables that fall within a known range (like our CTR, which must sit between 0 and 1). It states that the probability of a sample mean ($\hat{\mu}$) deviating from the true mean ($\mu$) drops exponentially as sample size ($n$) increases:
\[P(|\hat{\mu}_i - \mu_i| \ge \epsilon) \le 2 \exp\left( - 2n_i\epsilon^2 \right)\](Assuming rewards bounded in $[0,1]$)
We want to find a confidence radius $\epsilon$ such that the probability of the true mean exceeding our bound is some small value $\delta$.
Before we set up the equation, it is important to pause and highlight the difference between these two error-related variables so they aren’t confused:
- The Margin of Error ($\epsilon$): How far off our estimate is from reality (e.g., “our estimated CTR is off by 2%”).
- The Probability of Failure ($\delta$): The likelihood that our estimate is off by that margin (e.g., “there is only a 1% chance our estimate is off by 2%”).
Because the right-hand side of Hoeffding’s equation ($2 \exp(-2n_i\epsilon^2)$) calculates the maximum limit of that failure probability, we can set it equal to our target $\delta$. This allows us to reverse-engineer the math and solve for exactly how wide our margin of error ($\epsilon$) needs to be to guarantee that level of safety!
Setting the RHS to $\delta$:
\[2 e^{-2 n_i \epsilon^2} = \delta\] \[\Rightarrow -2 n_i \epsilon^2 = \ln(\delta/2)\] \[\Rightarrow \epsilon = \sqrt{\frac{\ln(2/\delta)}{2 n_i}}\]In bandits, we want our confidence to increase over time, so we set $\delta = 2t^{-4}$ (a decaying probability of error).
Substituting this into the equation gives us the exact UCB exploration term:
\[\epsilon = \sqrt{\frac{2 \ln t}{n_i}}\]4.d) Python Implementation
1
2
3
4
5
6
7
8
9
10
11
12
13
14
15
16
17
18
19
20
21
22
23
24
25
26
27
28
29
30
31
32
33
34
35
36
37
38
39
40
41
42
43
44
45
46
47
48
49
50
51
52
53
54
55
56
57
58
59
60
61
62
63
64
65
66
67
68
69
70
71
72
73
74
75
76
77
78
79
80
81
82
83
84
85
import numpy as np
import matplotlib.pyplot as plt
import seaborn as sns

class UCB:
    def __init__(self, n_arms):
        self.n_arms = n_arms
        self.counts = np.zeros(n_arms)   # n_i
        self.values = np.zeros(n_arms)   # mu_hat
        self.t = 0

    def select_arm(self):
        # Explore all arms at least once
        for i in range(self.n_arms):
            if self.counts[i] == 0:
                return i

        # Calculate UCB score
        ucb_values = self.values + np.sqrt((2 * np.log(self.t)) / self.counts)
        return np.argmax(ucb_values)

    def update(self, arm, reward):
        self.t += 1
        self.counts[arm] += 1
        n = self.counts[arm]
        value = self.values[arm]

        # Incremental mean update
        self.values[arm] = value + (reward - value) / n

# 1. Setup Use Case: 3 Ads with unknown true CTRs
# (Matching the Thompson Sampling example)
ad_names = ['Ad A', 'Ad B', 'Ad C']
true_ctrs = [0.04, 0.055, 0.03]
n_arms = len(true_ctrs)

# Initialize the Bandit
bandit = UCB(n_arms)

# 2. Define simulation parameters
n_trials = 10000

# We will track the estimated CTRs over time for plotting
estimates_history = np.zeros((n_trials, n_arms))

# 3. Run the simulation
for step in range(n_trials):
    # Step 1: Bandit selects the ad based on the highest Upper Confidence Bound
    chosen_arm = bandit.select_arm()

    # Step 2: Simulate user behavior (Click = 1, No Click = 0)
    reward = 1 if np.random.rand() < true_ctrs[chosen_arm] else 0

    # Step 3: Bandit updates its empirical counts and estimated means
    bandit.update(chosen_arm, reward)

    # Track the estimates for our plot
    estimates_history[step] = bandit.values.copy()

# Output simulation results
print(f"Total Impressions: {n_trials}")
for i in range(n_arms):
    print(f"{ad_names[i]} - Shown: {int(bandit.counts[i])} times | Estimated CTR: {bandit.values[i]:.4f} (True: {true_ctrs[i]:.4f})")

# 4. Plot the convergence of estimated CTRs using Matplotlib/Seaborn
# Because UCB doesn't use probability distributions, we plot how its estimates converge to reality over time
plt.figure(figsize=(10, 6))
sns.set_theme(style="whitegrid")
colors = sns.color_palette()

for i in range(n_arms):
    # Plot the algorithm's estimated CTR over time
    plt.plot(estimates_history[:, i], color=colors[i], label=f'{ad_names[i]} (Estimated)', linewidth=1.5, alpha=0.9)
    # Plot the true CTR as a flat dotted line for reference
    plt.axhline(y=true_ctrs[i], color=colors[i], linestyle=':', linewidth=2, alpha=0.8, label=f'{ad_names[i]} (True)')

plt.title('UCB: Convergence of Estimated CTRs over 10,000 Trials', fontsize=16, pad=15)
plt.xlabel('Trial (Impressions)', fontsize=14)
plt.ylabel('Estimated Click-Through Rate (CTR)', fontsize=14)

# De-duplicate legend labels so it looks clean
handles, labels = plt.gca().get_legend_handles_labels()
plt.legend(handles[:6], labels[:6], fontsize=12, loc='upper right')
plt.tight_layout()
plt.show()
5. Conceptual Differences: UCB vs. Thompson Sampling
Both algorithms are designed to solve the exact same problem: finding the optimal balance between exploring arms with high uncertainty and exploiting arms with high expected rewards. However, their underlying mathematical philosophies lead to different operational mechanics.
Here is a comprehensive breakdown of how they compare:
| Feature | Upper Confidence Bound (UCB) | Thompson Sampling (TS) |
|---|---|---|
| Statistical Philosophy | Frequentist: Relies on point estimates and deterministic confidence intervals based on observed data. | Bayesian: Relies on probability distributions, updating prior beliefs continuously to form a posterior. |
| Decision Mechanism | Deterministic: If we run UCB twice with the exact same historical data, it will absolutely always pick the same next arm. | Stochastic (Probabilistic): It samples randomly from distributions. Given the exact same history, it might pick different arms on different runs. |
| Exploration Strategy | Optimism Under Uncertainty: Calculates a mathematical “best-case scenario” (upper bound) and always trusts it. | Probability Matching: Selects an arm exactly proportional to the probability that it is the true optimal arm. |
| Handling Prior Knowledge | Difficult: It is hard to inject business logic (like “we suspect this new ad will perform at 5%”) into a strict Frequentist model. | Native & Easy: We can easily inject business logic by shaping the initial Prior distribution (e.g., setting a specific Beta prior). |
| Delayed Feedback | More exposed: with delayed rewards, UCB keeps recomputing the same deterministic bound and can over-exploit one arm until the pending outcomes finally land. | More forgiving: its randomization keeps spreading traffic across promising arms even before feedback arrives. This is a tendency, not immunity: under heavy delay both algorithms need pending-outcome accounting or delay-aware variants. |
| Underlying Math | Hoeffding’s Inequality / Statistical Concentration Bounds. | Bayes’ Theorem / Conjugate Priors. |
The Practical Reality:
While UCB offers beautiful, rigorous guarantees (we can strictly prove its regret bounds), Thompson Sampling is widely used and often preferred in production: feedback is usually delayed, data is messy, and product managers want to inject prior business knowledge, and TS accommodates all three more naturally. This is an empirical observation, though, not a theorem: which algorithm wins depends on the reward distribution, the gaps, the delay structure, and the tuning. Treat “TS usually does well in practice” as a strong prior, not a guarantee.
6. Regret Comparison Recap
Now that we understand the algorithms, let’s look back at how they perform against our evaluation metric: Regret.
- $\epsilon$-Greedy (fixed-$\epsilon$ baseline): Explores blindly with a fixed probability $\epsilon$. Its Regret grows linearly: $O(\epsilon T)$. It never stops wasting traffic.
- UCB: Explores intelligently, shrinking its bonus over time. Under a stationary model its Regret grows sub-linearly ($O(\log T)$), so its average regret approaches zero.
- Thompson Sampling: Also sub-linear ($O(\log T)$), and structurally often yields the lowest absolute regret in empirical practice.
We can watch all three race on a shared three-arm Bernoulli simulator with well-separated reward rates (0.10, 0.20, 0.35), chosen so the regret shapes stay legible; near-identical arms are discussed below.
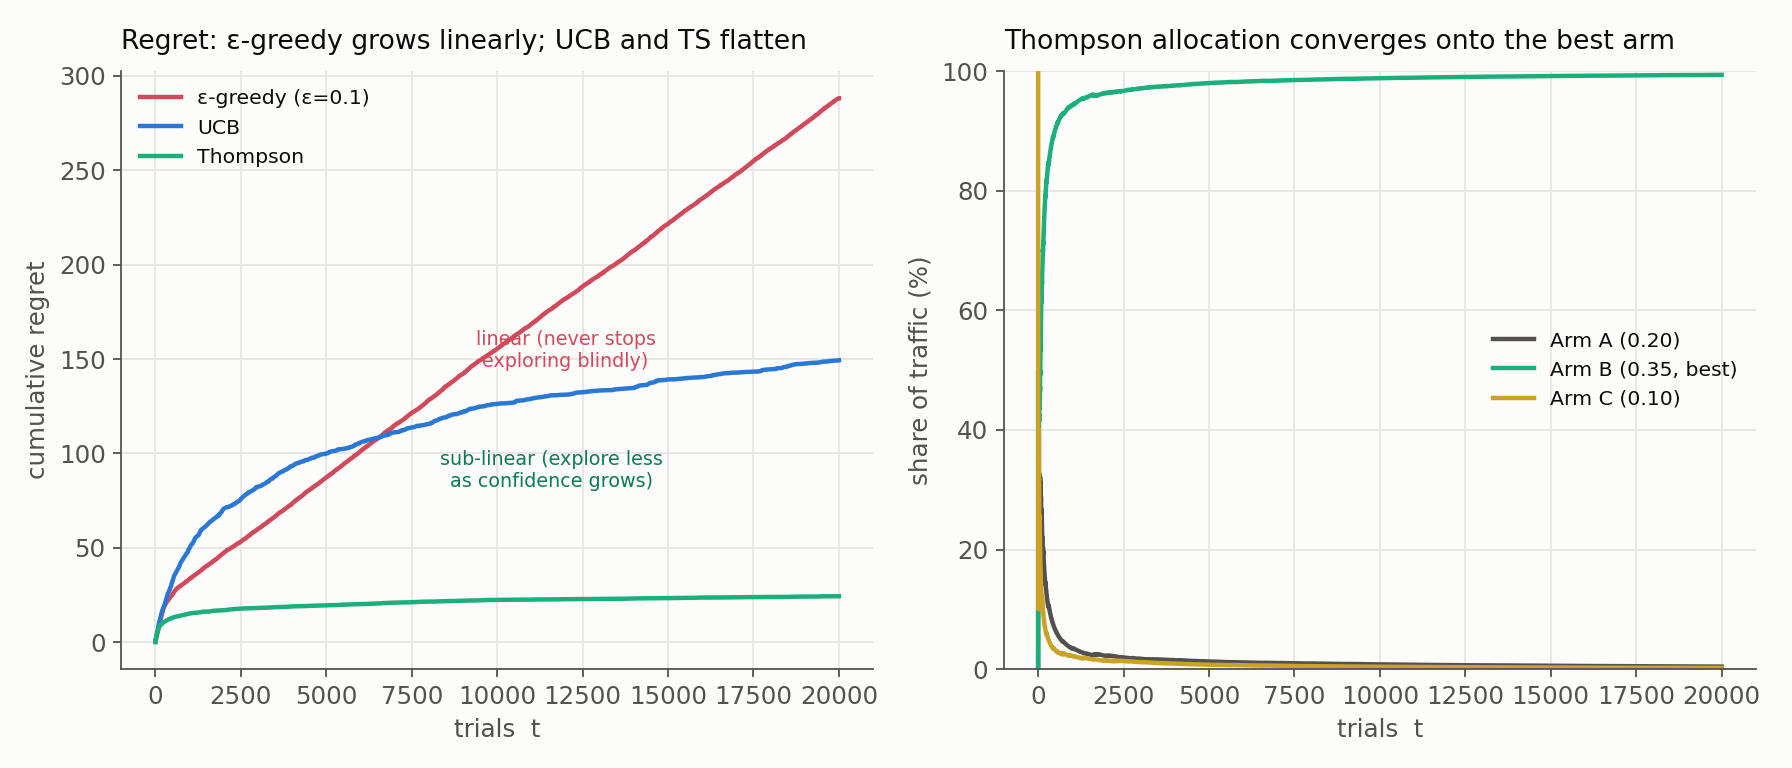
The left panel is the whole story: $\epsilon$-greedy’s regret is a straight line (constant slope, exploring at a fixed 10% rate forever), while UCB and Thompson bend as their exploration decays. Thompson is lowest here, and its traffic share (right panel) collapses onto the best arm, reaching ~99% by the end - what “smoothly transitioning from exploration to exploitation” looks like operationally.
One honest caveat the picture depends on: those constants matter. When arms are nearly tied (like the 4% vs 5.5% ad CTRs in our code example) UCB’s fixed exploration constant makes it over-explore for a very long time - long enough that over practical horizons its cumulative regret can actually trail even $\epsilon$-greedy. “Logarithmic regret” is asymptotic, and its constant grows as the gap between arms shrinks. That is why this ranking is not a fixed leaderboard: it depends on the gaps, the horizon, and the tuning.
7. The Hidden Cost: Valid Inference Under Adaptive Collection
Bandits buy their lower regret with a currency the earlier posts worked hard to establish: clean statistical inference. In a randomized A/B test, every unit had a fixed, known probability of assignment, which is what makes a naive sample mean unbiased and a classical confidence interval valid. A bandit breaks that: the probability an arm is shown at time $t$ depends on the rewards observed before $t$, so assignment and outcome are entangled. Two consequences follow:
- Naive arm means are biased. An arm that got unlucky early is shown less, collecting fewer adaptively-selected samples, so its sample mean is a biased estimate of its true rate. The mechanism that lowers regret (starving apparently-bad arms) is what corrupts their estimates: in the simulation above, the two losing arms end with only a sliver of traffic, and their empirical CTRs are not to be trusted.
- Classical p-values and confidence intervals no longer hold. They were derived assuming i.i.d. sampling under fixed assignment probabilities. Under adaptive collection, a nominal 95% interval does not have 95% coverage.
The remedy is not to abandon bandits but to log enough to reconstruct the assignment mechanism, then use estimators that account for it. For every decision, record:
- the eligible unit and timestamp;
- the context available at the moment of assignment;
- the arm chosen;
- the probability of choosing each eligible arm (the propensity);
- the model version and prior in force;
- the observed reward and its delay;
- any guardrail outcomes.
With logged propensities, post-hoc estimation can use inverse-propensity weighting or doubly robust estimators (the machinery the causal post used for observational data) to recover unbiased estimates, usually with an exploration floor (a minimum assignment probability per arm) so no propensity collapses to zero. The short version: a bandit optimizes reward; a trustworthy read on “how much better was B, really?” afterwards is a separate, deliberate step.
Production Safeguards
Because a bandit is a control system acting on live traffic rather than a one-shot analysis, deploying one responsibly means wrapping it in operational guardrails:
- Traffic floors and caps per arm: a floor keeps every arm identifiable, a cap limits blast radius.
- Hard guardrails and a kill switch on business metrics, so no arm can quietly tank revenue or latency.
- A safe ramp-up on a small traffic slice before full rollout.
- Prior-sensitivity checks and non-stationarity monitoring, since the base algorithms assume stable arms.
- Reward-delay, censoring, and duplicate-reward handling.
- Fairness constraints where the action affects people, and a fallback if the policy service fails.
- Reproducible policy versioning, so any decision can be replayed and audited.
8. When Does Each Model Shine?
- Use UCB when: We need strict mathematical guarantees, our rewards are strictly bounded, computations must be entirely deterministic (e.g., rigid caching rules), or setting up Bayesian priors is difficult.
- Use Thompson Sampling when: We are in a production business environment. TS is widely considered the industry standard because it adapts faster to complex reward distributions, seamlessly handles delayed feedback, and allows us to inject business logic into the prior distributions.
9. The Next Frontier: Contextual Bandits
MAB algorithms are incredibly powerful, but they have one massive limitation: They find one global winner for everyone. If we use standard Thompson sampling on Netflix, it will figure out the globally most popular movie and recommend it to every single user.
Contextual Bandits fix this by introducing a state or “context” ($x_t$) before making a decision. Instead of estimating $\mu_a$ (reward of the arm), we estimate $\mu(x, a)$ (reward of the arm given the user’s features).
The Intuition
- Standard Bandit: Which ad is best overall?
- Contextual Bandit: Which ad is best for a 25-year-old on a mobile device on a Sunday morning? This transforms the bandit problem into a fusion of Supervised Learning and Exploration, unlocking the holy grail of modern tech: Personalization.
A caution that rides along with that power: context features like age, gender, or location can encode or proxy protected attributes, so a reward-optimizing policy can quietly produce unfair or non-compliant treatment. Context choice is a fairness and privacy decision, not only a modelling one. Context must also be available before the action and exclude anything the action could change (no post-treatment leakage), the same discipline the causal posts insisted on.
Extending UCB to Contextual Bandits (LinUCB)
To understand how this works in practice, let’s look at how we can upgrade our standard UCB algorithm into a Contextual UCB algorithm, famously known as LinUCB (Linear UCB).
Let’s stick to our ad targeting campaign, but now we have a single piece of context: the user’s Age ($x$). How does LinUCB make a decision for a new visitor?
Step 1: The Linear Assumption
In standard UCB, we just tracked a single estimated mean ($\mu$) for Ad A. In LinUCB, we assume the reward (CTR) is a linear function of the context. For Ad A, we assume:
\[\text{CTR}_A = \theta_0 + \theta_1 \cdot \text{Age}\]A caveat worth flagging now and resolving in the epilogue: a linear model of a probability can predict values outside $[0, 1]$, since a straight line does not respect the bound. Treating CTR as $\theta_0 + \theta_1 \cdot \text{Age}$ is a convenient approximation for expected reward, not a correctly specified model for a binary outcome. The principled fix is a logistic (GLM) bandit, which passes the linear score through a link function keeping predictions in $[0, 1]$; Bayesian linear regression on binary data (Contextual TS below) is the same approximation on the Bayesian side. This is the gap the GLM epilogue closes.
Step 2: Regression for Exploitation
As users interact with Ad A, we plot their Age on the x-axis and their click outcome (0 or 1) on the y-axis. Instead of just taking a simple average, the algorithm runs a continuous Ridge Regression to find the best-fit line (estimating our $\theta$ parameters).
When a new 25-year-old user arrives, our Exploitation term is simply the predicted CTR from that regression line at $x = 25$.
Step 3: Context-Aware Exploration
This is where the magic happens. In standard UCB, our uncertainty bonus shrank as we pulled the arm more often ($\frac{1}{\sqrt{n}}$). In LinUCB, our uncertainty is modeled as a confidence boundary around the regression line.
Suppose we have shown Ad A to thousands of 25-year-olds, but we have never shown it to a 60-year-old. The algorithm knows its regression line is highly accurate around age 25, but highly uncertain at age 60. Therefore, the exploration bonus will be tiny for a 25-year-old, but massive for a 60-year-old!
Step 4: The Contextual UCB Score
For every new user, the algorithm calculates a custom score for each ad based on their specific age:
\[\text{LinUCB Score} = (\text{Predicted CTR at User's Age}) + (\text{Uncertainty Bound at User's Age})\]The algorithm selects the ad with the highest score, seamlessly implementing “optimism under uncertainty” on a personalized, user-by-user basis!
Extending Thompson Sampling to Contextual Bandits (Contextual TS)
If LinUCB is the contextual upgrade to standard UCB, what happens when we upgrade Thompson Sampling to handle contexts? Enter Contextual Thompson Sampling (often implemented via Bayesian Linear Regression).
Let’s use the exact same example: predicting Ad A’s CTR based on a user’s Age ($x$). We still assume the relationship is linear:
\[\text{CTR}_A = \theta_0 + \theta_1 \cdot \text{Age}\]However, our approach to uncertainty changes entirely from frequentist bounds to Bayesian distributions.
Step 1: Distributions over Parameters
In standard Thompson Sampling, we kept a Beta distribution for a single CTR value. In Contextual TS, we maintain a multivariate probability distribution (usually a Gaussian/Normal distribution) over the actual regression weights ($\theta_0$ and $\theta_1$).
At first, these distributions are wide and flat. We have no idea what the baseline CTR ($\theta_0$) is, nor how Age affects it ($\theta_1$).
Step 2: Sampling a “Reality”
A new 25-year-old user arrives. Instead of looking at a “best-fit” line and adding a math bonus like LinUCB, Contextual TS takes a random sample from its weight distributions.
It literally draws a random $\tilde{\theta}_0$ and a random $\tilde{\theta}_1$ from its current beliefs. This effectively means the algorithm samples one possible regression line out of the infinite lines that could fit the data.
Step 3: Calculating the Sampled Score
Using those randomly drawn weights, the algorithm calculates the expected CTR for this specific user:
\[\text{Sampled Score} = \tilde{\theta}_0 + \tilde{\theta}_1 \cdot 25\]It does this for every ad and shows the ad with the highest sampled score.
Step 4: The Bayesian Update
After observing if the 25-year-old clicked or not, the algorithm performs a Bayesian Linear Regression update. It adjusts the multidimensional distributions of $\theta_0$ and $\theta_1$. If there was a click, the distributions shift to make the sampled weights more likely in the future, and they become slightly narrower (more confident).
The Magic of Contextual TS
If we have rarely shown the ad to 60-year-olds, our distribution of possible regression lines is highly varied at $x = 60$. When a 60-year-old arrives, the sampled regression lines will yield wildly different CTR predictions, naturally driving high exploration. As we gather more data, the distribution of lines narrows, and the algorithm transitions smoothly into exploiting the true optimal personalized ad!
Further Study Elements: Where Do We Go From Here?
LinUCB and Contextual TS assume a simple linear world, but real-world engineering often requires much more complex systems. To dive deeper into advanced personalization and experimentation architecture, look into these concepts:
- Beyond Linear (Deep & Logistic Bandits): What if the relationship between context and reward isn’t a straight line? Neural Bandits use deep neural networks to learn highly complex, non-linear representations of user state. Logistic Bandits specifically tailor the math to binary classification outcomes (like click vs. no-click).
- Off-Policy Evaluation (OPE): How do we evaluate a brand new bandit algorithm before deploying it to live users? OPE uses historical, biased log data to estimate how a new policy would have performed, relying on advanced causal inference techniques like Inverse Propensity Scoring (IPS) and Doubly Robust estimators.
- Combinatorial Bandits: Instead of picking a single best ad, what if we need to pick an entire combination of 5 ads to display on a single webpage to maximize overall page yield without cannibalization?
- Full Reinforcement Learning (RL): Contextual bandits are essentially “one-step” reinforcement learning. If the ad we show to a user actually changes their future context or state (e.g., they get ad fatigue and stop clicking altogether), we move from bandits into the realm of full Markov Decision Processes (MDPs) and Deep RL!
Where This Leaves Us (and the Epilogue Ahead)
From the humble p-value to Contextual Bandits, this series has traced the full arc of experimentation: from estimating an effect under clean randomization, through recovering effects when randomization is gone (causal inference), to optimizing reward while learning with bandits. Two threads recurred throughout: stopping rules and power from sample-size planning, and the careful definition of estimands from the causal post.
One question ties nearly all of it together. A t-test assumes roughly normal outcomes; a proportion test assumes binary ones; the bandit above assumed a Bernoulli reward and then modelled it with a linear function that ignores the $[0,1]$ bound. Is there one modelling language that handles continuous, binary, and count outcomes uniformly, without pretending to supply the experimental design? There is, and it is the subject of the short epilogue on generalized linear models that closes the series.
Happy experimenting - onward to the epilogue.