Epilogue: The Common Thread Behind A/B Testing (Enter the GLM)
The Generalized Linear Model as the common modeling language behind t-tests, ANOVA, proportion tests, and CUPED - and the design, estimand, and inference layers a GLM does not supply.
The closing note of the statistical-inference arc, tying together p-values and CIs, z and t statistics, A/B design, sample size, causal inference, and bandits.
Welcome to the epilogue of our series on experimentation and A/B testing! Over the past few months, we’ve covered a massive amount of ground. We started with the foundational statistics of p-values and z-tests, navigated the tricky waters of Sample Ratio Mismatch (SRM), ventured into the complex realm of causal inference (DiD, PSM, IV), and finally arrived at the cutting-edge world of Multi-Armed and Contextual Bandits.
Looking back, it might feel like we’ve amassed a massive toolbox containing dozens of completely different, highly specialized tools.
But recently, a perceptive reader on LinkedIn left a fantastic comment that inspired this final post. He pointed out the missing link. What if a large part of what we’ve learned in this series is actually one tool wearing different disguises?
That single, recurring engine is the Generalized Linear Model (GLM).
Often taught in a separate mental silo as a “predictive machine learning algorithm,” the GLM is the closest thing experimentation has to a common modeling language. One point of honesty up front, though, because we will keep returning to it: a GLM unifies how we write down the outcome model, and that is genuinely powerful, but it is not a grand theory that replaces experimental design, causal identification, or the choice of what to estimate. It is one layer of the problem, not the whole of it. With that caveat planted, let’s see how much of the A/B testing landscape really does map onto GLMs.
For a quick refresher first, the section on GLMs in our Linear Regression article is a good starting point.
The Four Layers (so we don’t overclaim)
Before the mapping, it helps to name the four distinct layers of any experiment analysis, because a GLM lives almost entirely in one of them:
- Design - how units are assigned and outcomes observed (randomization, timing, clustering). This is where causal validity is earned.
- Estimand - the quantity the decision actually needs (an absolute lift? a risk difference? a rate ratio? an effect for compliers?).
- Mean model and link - how the expected outcome relates to the predictors. This is the GLM’s home turf: the family (Gaussian, Binomial, Poisson) and the link (identity, logit, log).
- Inference - the variance estimator and reference distribution (model-based, robust, clustered, randomization-based, or Bayesian).
The unification this post celebrates is real, but it happens in layer 3. A GLM cannot manufacture exchangeability, an exclusion restriction, parallel trends, no-interference, or a valid adaptive-assignment scheme. Keep these four layers in view, and every “it’s just a GLM” claim below lands with the right weight.
1. The Basics: T-Tests and ANOVA are Linear Regression in Disguise
In Part 2 and Part 3, we learned about 2-sample t-tests and ANOVA for comparing continuous metrics like avg-test-score.
Re-interpretations of T-test and ANOVA
Mathematically, running a 2-sample t-test is closely equivalent to running a standard Linear Regression (a GLM with a Gaussian family and Identity link). If we assign our Control group as $T = 0$ and our Treatment group as $T = 1$, the equation looks like this:
\[Y_i = \beta_0 + \beta_1 T_i + \epsilon_i\]- $\beta_0$ is the average of our Control group.
- $\beta_1$ is the exact absolute lift caused by the Treatment.
- The p-value the model reports for $\beta_1$ matches the classic t-test p-value under matching assumptions.
One qualification worth making precise, because the z and t post made Welch’s test our default. The point estimate $\beta_1$ equals the raw difference in means no matter what. The test, however, is identical only to the equal-variance (Student) t-test, and only when we read off the regression’s default homoskedastic standard errors. To reproduce Welch’s t-test (unequal variances, the safer default), we need heteroskedasticity-robust standard errors and the matching degrees-of-freedom handling, not the vanilla OLS output. So “t-test = regression” is true, but which t-test depends on the standard-error procedure we pair with it. That is our first glimpse of the theme: the family and link (layer 3) are only half the story; the variance estimator (layer 4) is the other half.
ANOVA is simply this exact same equation expanded to include $T_2, T_3$, etc.
ANOVA with 3 Variants
Imagine we are running an A/B/C test. We have a Control, Treatment 1, and Treatment 2.
To feed this into a linear regression model, the math requires us to use “dummy encoding” (1s and 0s). However, to avoid a mathematical error called the dummy variable trap (perfect multicollinearity), we don’t create a variable for all three groups. We drop one group to serve as our Reference Group (the baseline). Naturally, we choose the Control group.
Our model creates two variables:
- $T_{1i} = 1$ if the user is in Treatment 1, otherwise $0$.
- $T_{2i} = 1$ if the user is in Treatment 2, otherwise $0$.
The ANOVA linear regression equation becomes:
\[Y_i = \beta_0 + \beta_1 T_{1i} + \beta_2 T_{2i} + \epsilon_i\]Interpreting the Coefficients ($\beta$)
Because of how we set up the 1s and 0s, the coefficients map perfectly to our variant means and the absolute lift. Let’s look at the math for each specific group:
1. The Control Group (The Baseline) For a user in the Control group, both $T_{1i}$ and $T_{2i}$ are $0$.
\[Y_i = \beta_0 + \beta_1(0) + \beta_2(0)\] \[Y_i = \beta_0\]- Interpretation of $\beta_0$: The Intercept ($\beta_0$) is simply the average score of the Control group.
2. Treatment 1 For a user in Treatment 1, $T_{1i} = 1$ and $T_{2i} = 0$.
\[Y_i = \beta_0 + \beta_1(1) + \beta_2(0)\] \[Y_i = \beta_0 + \beta_1\]- Interpretation of $\beta_1$: Since $\beta_0$ is the Control average, $\beta_1$ represents the exact absolute lift caused by Treatment 1. (i.e., $\text{Treatment 1 Mean} - \text{Control Mean}$).
3. Treatment 2 For a user in Treatment 2, $T_{1i} = 0$ and $T_{2i} = 1$.
\[Y_i = \beta_0 + \beta_1(0) + \beta_2(1)\] \[Y_i = \beta_0 + \beta_2\]- Interpretation of $\beta_2$: Similarly, $\beta_2$ is the exact absolute lift caused by Treatment 2. (i.e., $\text{Treatment 2 Mean} - \text{Control Mean}$).
The P-Values: Global vs. Individual
When we run a traditional ANOVA, it spits out a single Global p-value (from an F-test) that tells us: “Is there a significant difference anywhere between these groups?” When we run this as a Linear Regression, we get a richer output:
- The F-Statistic P-Value: The regression summary will have an overall F-statistic at the bottom. This is the exact same p-value we get from the traditional ANOVA. It tests if any of the $\beta$ coefficients ($\beta_1$ or $\beta_2$) are different from zero.
- The Coefficient P-Values: The model also gives individual p-values for $\beta_1$ and $\beta_2$. These are contrasts against the reference group (Control): the p-value for $\beta_1$ tests Treatment 1 vs Control, and the p-value for $\beta_2$ tests Treatment 2 vs Control. Two cautions here. First, they are not the full set of post-hoc comparisons - they say nothing about Treatment 1 vs Treatment 2, which is a separate contrast we would have to request explicitly. Second, treating them as free “post-hoc tests” glosses over multiplicity.
(On multiplicity: the moment we inspect several coefficients or pairwise comparisons, the family-wise error rate inflates exactly as in the Bonferroni discussion from the parametric-tests post. Planned contrasts should be pre-specified; for all-pairwise comparisons a simultaneous procedure like Tukey’s HSD (or Dunnett’s, for many-versus-control) is the right tool. The math is all in one GLM output, but the correction is not automatic.)
2-Proportion Z-Tests
What about our 2-proportion Z-tests for Conversion Rates? The natural GLM cousin is a Binomial family with a Logit link, otherwise known as Logistic Regression.
Here the “it’s the same thing” story needs care, because the two operate on different scales. The 2-proportion z-test works directly on the probability (risk-difference) scale: it asks whether $p_{\text{treatment}} - p_{\text{control}}$ differs from zero. Logistic regression works on the log-odds scale, and its coefficient is a log-odds ratio. They test the same underlying hypothesis and agree asymptotically, but they are not numerically identical in a finite sample. Even within logistic regression, the Wald, score, and likelihood-ratio tests give slightly different p-values, especially in small or sparse samples.
That scale difference is not a technicality for anyone making a product decision. A logistic coefficient exponentiates to an odds ratio (“2.1x the odds”), which is easy to misread as a lift in the rate. What the business usually wants is the risk difference or relative lift on the probability scale, a marginal effect: “conversion went from 4.0% to 4.8%, a +0.8pp (+20%) lift.” Always be explicit about which of the three quantities is being reported: the log-odds coefficient, the odds ratio, or the probability-scale effect.
Our Chi-Square tests? Here too the clean version is narrower than “chi-square = Poisson.” A chi-square test of independence or goodness-of-fit in a contingency table can be written as a log-linear Poisson (or multinomial) model, with the same asymptotics, once we fix the table structure, the constraints, and the degrees of freedom. But that is a statement about table-count models specifically; a chi-square test of a variance is an entirely different construction and maps to nothing of the sort.
2. Variance Reduction: Supercharging Sample Sizes
In Part 4, we talked about the pain of calculating sample sizes. What if we need to detect a tiny effect, but we simply don’t have enough daily traffic?
By framing our A/B test as a GLM, we unlock a superpower: Covariate Adjustment (closely related to the technique the industry calls CUPED - Controlled-experiment Using Pre-Existing Data).
Instead of just looking at the treatment indicator ($T_i$), we can add pre-experiment knowledge about our users into the model:
\[Y_i = \beta_0 + \beta_1 T_i + \beta_2 X_{i, \text{history}} + \epsilon_i\]What exactly is $X_{i, \text{history}}$? This is our Covariate, and for the adjustment to be valid rather than merely convenient, it must satisfy a few conditions. It must be:
- measured before the experiment started, so it is a genuine pre-period quantity;
- unaffected by the treatment assignment (adjusting for anything the treatment could have changed reintroduces bias, the mediator problem from the causal post);
- defined consistently for both arms, and ideally strongly predictive of the outcome.
In e-commerce, the standout covariate that ticks all three boxes is the user’s historical spend.
Let’s look at a practical toy example to see the math in action: Imagine we are testing a new checkout flow designed to increase Average Order Value (AOV). Both the treatment and control groups are a mix of wildly different shoppers. To see the problem, picture two of them - and remember the same mix lives in both arms:
- Shopper A (The Whale): Their historical average order value is \$500. So, for Shopper A, $X_{i, \text{history}} = 500$.
- Shopper B (The Bargain Hunter): Their historical average order value is \$20. So, for Shopper B, $X_{i, \text{history}} = 20$.
Let’s assume our new checkout flow genuinely adds exactly \$10 to everyone’s basket. A treated Whale spends \$510; a treated Bargain Hunter spends \$30.
The Math: Why the \$480 Gap Drowns the \$10 Signal
If we run a standard t-test (which ignores the $X$ covariate), the statistical engine only sees the final numbers: 510 and 30.
To determine if our \$10 lift is statistically significant, the t-test calculates the Standard Error (SE) of our treatment effect. The formula for standard error relies entirely on the overall variance ($\sigma^2$) of the raw metric $Y$:
\[SE(\text{Lift}) \approx \sqrt{\frac{\sigma^2}{N}}\]Because our raw data bounces wildly between 30 and 510, the overall variance ($\sigma^2$) is absolutely massive. When $\sigma^2$ is a massive number, our Standard Error becomes a massive number.
To get statistical significance, our observed lift (\$10) needs to be roughly twice as large as the Standard Error. If the natural \$480 gap between our Whale and our Bargain Hunter pumps the Standard Error up to \$50, our tiny \$10 signal is completely drowned out. The math assumes the \$10 difference is just random noise. The only way to shrink the SE in a standard t-test is to blindly increase $N$ (the sample size) to thousands or millions of users.
The GLM Solution: Conditioning on Predictable Variation
Now, we use our GLM and include $X_{i, \text{history}}$ as a covariate.
The key idea is not that the model simply “ignores” raw variance, but that it conditions on predictable variation. It mathematically separates the data into two buckets:
- Predictable variation (explained by $X$)
- Unpredictable variation (residual noise)
Formally, the CUPED mechanism performs an adjustment of the form:
\[Y_i' = Y_i - \theta (X_i - E[X])\]where:
\[\theta = \frac{\text{Cov}(Y, X)}{\text{Var}(X)}\]This transformation removes the component of $Y$ that is linearly predictable from $X$, leaving behind a purified, lower-variance signal ($Y_i’$).
Two honesty notes here. First, $\theta$ is not handed to us; it is estimated from pre-period data, ideally pooled across both arms and either pre-specified or fit on a held-out split so it cannot be tuned to flatter the result. Second, this CUPED transform and simply adding $X$ as a regression covariate are closely related, and often algebraically equivalent, but not universally identical: they can diverge depending on how $\theta$ is estimated, whether the covariate enters linearly, and how the standard error is computed. Treat them as two implementations of one idea (soak up predictable variance before judging the treatment), not as guaranteed twins.
We can interpret this directly through the lens of our GLM regression: the model explains a massive portion of the variance in $Y$ using $X$, leaving only a much smaller residual variance:
\[\sigma_{\text{residual}}^2 = \text{Var}(Y \mid X)\]Because historical spend ($X$) is highly correlated with current spend ($Y$), most of the wild variation (like that \$480 gap between our Whale and Bargain Hunter) is explained away before we evaluate the treatment effect.
So, rather than “changing the formula,” we are simply reducing the unexplained variance that feeds into the exact same statistical machinery. Our new Standard Error plummets because it relies on this reduced residual variance:
\[SE(\text{Lift})_{\text{adjusted}} \approx \sqrt{\frac{\sigma_{\text{residual}}^2}{N}}\]Because the numerator is now tiny, our \$10 treatment signal becomes crystal clear. We can confidently declare our \$10 lift as statistically significant with a fraction of the original sample size required!
Does it actually work? A quick simulation. With 300 users per arm, a true lift of exactly \$10, and historical spend $X$ correlated with current spend $Y$ at $r = 0.98$:
- Unadjusted (a plain difference in means that ignores $X$): estimated lift $\approx$ -\$1.63, standard error \$9.61 (a $t$ of $-0.17$). Not remotely significant, and the sign is even wrong - the \$480-scale spread between Whales and Bargain Hunters has swamped the \$10 signal.
- CUPED / covariate-adjusted (the GLM with $X$): estimated lift $\approx$ +\$9.03, standard error \$2.00 (a $t$ of $4.5$). Comfortably significant, and right on the true \$10.
In expectation both estimators are unbiased under randomization; what collapsed is the variance feeding the standard error, by about 96% here, because $X$ explains almost all of $Y$’s spread:
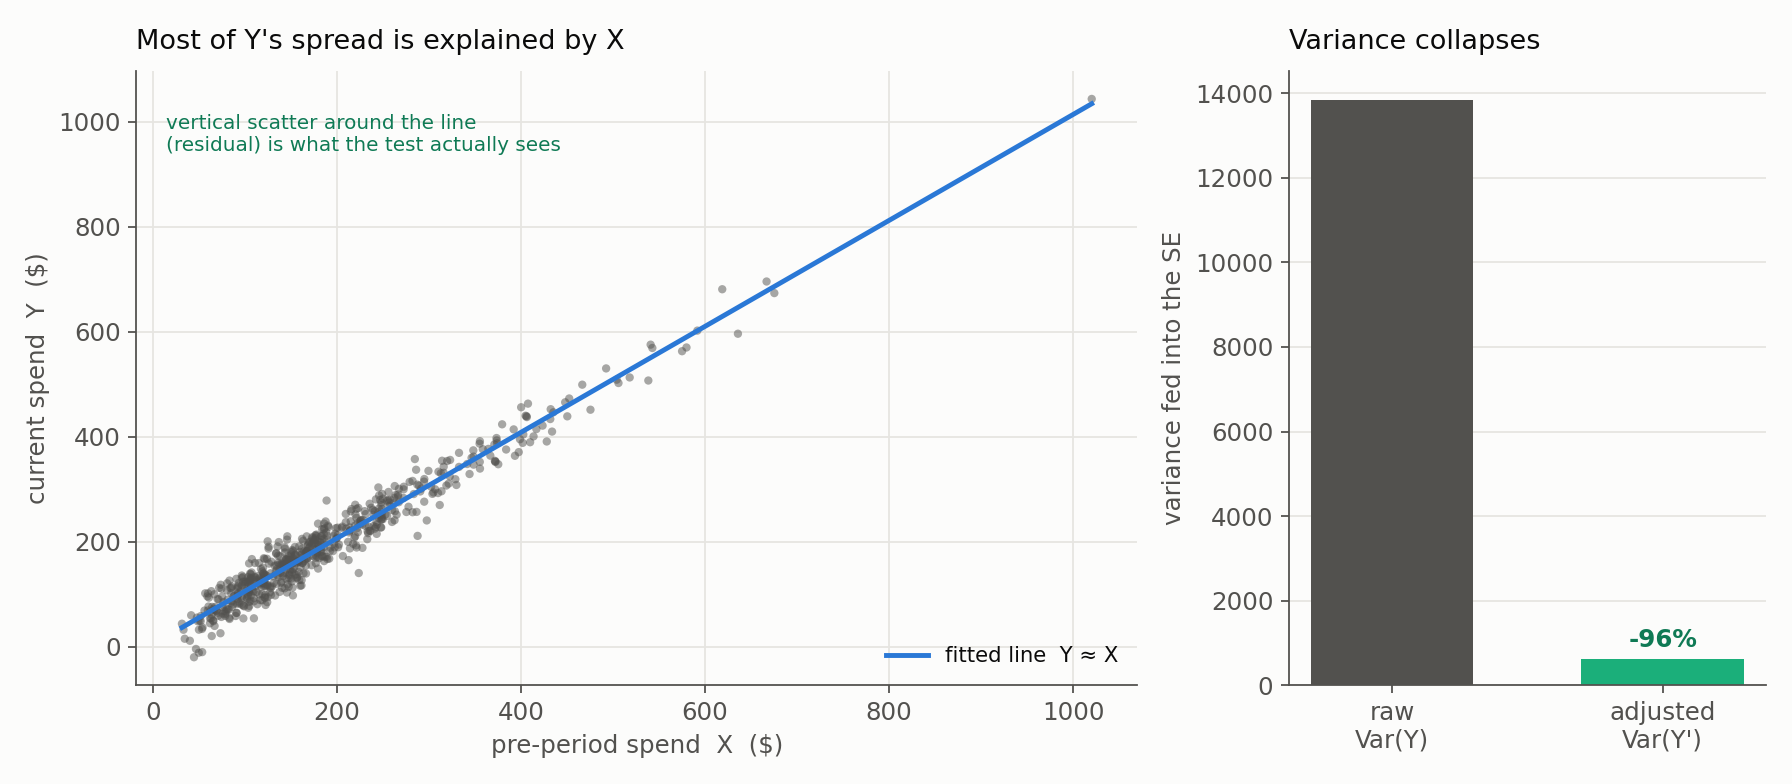
That 96% variance reduction is why the adjusted standard error (\$2.00) is about a fifth of the unadjusted one (\$9.61): we detect the same \$10 lift with a small fraction of the sample the raw test would have demanded. One caveat to carry forward: the standard-error formulas above are the simple equal-allocation sketch; a real analysis pins down the covariance estimator (and honours the treatment allocation) as carefully as it pins down the family and link.
3. Causal Inference: GLMs Under the Hood (but Not in Charge)
In Part 5, we tackled situations where we couldn’t perfectly randomize our traffic. A GLM was often the estimation engine, but it pays to be precise about where the GLM ends and the causal reasoning begins:
- Propensity Score Matching (PSM): the propensity score itself came from a Logistic Regression (a GLM) predicting treatment assignment from the confounders. But the matching step is not a GLM - it is a separate design procedure that pairs units and restricts to the region of overlap. The GLM produced a score; it did not produce the causal comparison.
- Instrumental Variables (IV): two-stage least squares is an IV estimator, not a GLM. Running two regressions is part of the mechanics, but the quantity it identifies (a LATE for compliers) and its validity come from the instrument’s assumptions, not from any GLM family or link.
- Difference-in-Differences (DiD): we estimated the uplift with a linear model carrying an interaction term ($\beta_3(\text{Group}_i \times \text{Time}_t)$), and its causal content comes entirely from parallel trends, not from the regression. One subtlety worth flagging: in a linear model that interaction coefficient is the difference-in-differences on the outcome scale, but in a nonlinear GLM (a logistic or Poisson DiD) the interaction coefficient is generally not the arithmetic difference-in-differences of the outcome. It lives on the link scale, and recovering the effect on the natural scale takes an extra marginal-effects step.
The pattern repeats every time: the GLM provides a flexible estimation framework, but causal validity comes from the design assumptions (layers 1-2), not from the model itself (layer 3).
4. Contextual Bandits: A GLM Wrapped in an Exploration Policy
Finally, in Part 6, we explored Contextual Bandits. We specifically looked at LinUCB (Linear Upper Confidence Bound). As the name implies, LinUCB assumes the expected reward is a linear combination of the user’s context features. It uses a form of regularized linear regression (similar to Ridge Regression) to estimate rewards, but crucially augments this with an uncertainty term to drive exploration.
That “augments” is where the GLM stops: the regression is only the exploitation half. The bandit is the regression plus an exploration policy (the UCB bonus, or posterior sampling) plus the online allocation loop deciding who sees what next. Regression alone is not the bandit, and (as Part 6 stressed) the adaptive assignment that loop creates is exactly what breaks clean inference downstream.
But what if our bandit is trying to optimize Ad Clicks (a binary 0 or 1)? Linear models are bad at predicting bounded probabilities, the exact $[0,1]$ problem the bandit post flagged. The industry solution is GLM-UCB (Generalized Linear Bandits): we wrap the bandit in a logistic link function, letting it learn a Logistic Regression model on the fly while balancing exploration and exploitation. In practice these models are updated iteratively and often rely on approximations, making them more complex than a standard “fit-once” GLM, but the underlying statistical structure remains the same.
The Modeling Map
If one artifact is worth keeping from this epilogue, it is this table. It lines up the outcome we are analyzing, the GLM that models it, the number the decision actually needs, the inference trap to watch for, and the design assumption the GLM cannot supply:
| Outcome / question | Family + link | Decision-scale output | Variance / inference caution | Design assumption (not from the GLM) |
|---|---|---|---|---|
| Continuous mean (e.g. AOV) | Gaussian + identity | Mean difference | Welch / robust / clustered SE | Valid assignment; independent clusters |
| Binary conversion | Binomial + logit (or direct difference) | Risk difference, relative lift, or odds ratio | Sparse cells; odds-ratio non-collapsibility | Valid assignment and exposure |
| Counts / rates | Poisson + log | Rate ratio or difference | Overdispersion; exposure offset | Stable observation window |
| Multiple variants | Gaussian or outcome-appropriate GLM | Planned contrasts | Multiplicity across comparisons | Pre-specified family and contrasts |
| Baseline-adjusted outcome | Outcome model + pre-period covariate | Adjusted treatment effect | Covariate must be pre-treatment | Randomization / identification unchanged |
The two rightmost columns are the ones people skip. The variance/inference column is a reminder that choosing the right family and link (layer 3) does not hand us the right standard error (layer 4): we still pick between model-based, heteroskedasticity-robust, and cluster-robust SEs, watch for overdispersion in count and binomial models, check the link’s fit and any influential points, and report effects on the scale the decision uses. The design-assumption column is the recurring punchline of the whole series: the model estimates, the design justifies.
The Final Takeaway
When we study A/B testing and experimentation, we are usually taught Frequentist statistics. When we study predictive modeling, we are taught Machine Learning. Seeing that Generalized Linear Models bridge the two is a genuine leap: a t-test, a variance-reduction technique, and a contextual bandit share one modeling backbone, so we can stop memorizing isolated recipes and start thinking in a common language.
But the honest version of that insight is not “everything is a GLM.” It is:
Many familiar analyses share a regression representation. That representation lets us estimate effects consistently across outcome types - but trustworthy conclusions still depend on the design, the estimand, the assumptions, and the uncertainty.
So the reusable habit to carry out of the whole series is a four-question checklist, run in order, before trusting any result:
- Design: how were units assigned and outcomes observed? (Is a causal claim even licensed?)
- Estimand: what number does the decision need - an absolute lift, a risk difference, a rate ratio, an effect for compliers?
- Model and link: which GLM family and link matches the outcome? (This is the part this post unified.)
- Inference: what variance estimator and reference distribution are valid here - robust, clustered, sequential, adaptive-aware?
The GLM answers question 3 beautifully and lends a hand on 2 and 4. Question 1, and the framing of 2, are earned by everything the earlier posts were really about: design and validity threats, power and stopping rules, causal identification, and the allocation objective. Hold all four together and the toolbox stops feeling like dozens of disconnected tricks and starts feeling like one disciplined way of interrogating data.
That is the thread. Thanks for following the series through, from the first p-value to this last GLM.
Resources
- Microsoft Experimentation Platform: Deep Dive into Variance Reduction.
- WTF is variance reduction in A/B testing?