Linear Regression, Part 1: OLS Foundations
Derive the normal equation and understand the statistical guarantees, assumptions, invariances, and singularity limits of ordinary least squares.
Linear Regression series: Part 1: OLS Foundations · Part 2: Multicollinearity and Regularization · Part 3: Evaluation, Interpretation, and Extensions
Linear regression looks simple on the surface: fit a line that minimizes squared error. Underneath that line, however, sit the matrix algebra and statistical assumptions that determine when Ordinary Least Squares (OLS) works and when its conclusions can be trusted.
This first part develops that foundation. We will derive the normal equation, unpack the Gauss-Markov guarantee, clarify the role of normally distributed errors, and test what happens when the dataset is duplicated. We will finish at the boundary of ordinary least squares: the point where $X^T X$ cannot be inverted.
1. Deriving the Normal Equation
The Normal Equation is a method for finding the optimal parameters in a linear regression model without resorting to an iterative optimization algorithm like Gradient Descent. It provides a direct, analytical solution. Here is a step-by-step derivation using matrix notation.
The Linear Regression Model
First, let’s define the hypothesis of a linear regression model. For a given input feature vector $x$, the predicted output $h_\beta(x)$ is given by:
\[h_\beta(x) = \beta_0 + \beta_1 x_1 + \beta_2 x_2 + \dots + \beta_n x_n\]where:
- $\beta_0, \beta_1, \dots, \beta_n$ are the parameters (or weights) of the model.
- $x_1, x_2, \dots, x_n$ are the input features.
- For convenience, we define $x_0 = 1$ to incorporate the bias term $\beta_0$.
This can be written more compactly in vector form as:
\[h_\beta(x) = \beta^T x\]where:
- $\beta = [\beta_0, \beta_1, \dots, \beta_n]^T$ is the parameter vector.
- $x = [x_0, x_1, \dots, x_n]^T$ is the feature vector.
For a training set with $m$ examples, we can represent all the training data in matrix form:
- $X$ is the design matrix of size $m \times (n+1)$, where each row is a training example.
- $y$ is a vector of size $m \times 1$ containing the true output values.
- The vector of all predictions can be written as $X\beta$.
Notation Used Throughout the Series
| Symbol | Meaning |
|---|---|
| $m$ | number of training examples |
| $n$ | number of features (plus the intercept column $x_0 = 1$) |
| $X$ | the $m \times (n+1)$ design matrix |
| $y$ | the $m \times 1$ vector of observed targets |
| $\beta$ | a coefficient vector: the population parameter, or a generic candidate in an objective |
| $\hat{\beta}$ | the estimate of $\beta$ computed from data |
| $\epsilon$ | the unobservable error term |
| $\hat{y} = X\hat{\beta}$ | the model’s fitted values |
The Cost Function (Sum of Squared Errors)
The goal of linear regression is to find the optimal parameter vector $\beta$ that minimizes the difference between the predicted values and the actual values. This is typically done by minimizing a cost function. The most common cost function for linear regression is the Mean Squared Error (MSE), which is the average of the sum of squared differences (errors).
For $m$ training examples, the sum of squared errors $J(\beta)$ is:
\[J(\beta) = \frac{1}{2m} \sum_{i=1}^{m} (h_\beta(x^{(i)}) - y^{(i)})^2\]In the factor $\frac{1}{2m}$, the two pieces do different jobs: the $\frac{1}{2}$ exists purely so the derivative comes out clean (the 2 from differentiating the square cancels it), while the $\frac{1}{m}$ only rescales the objective by a constant. Neither changes where the minimum lies.
Using matrix notation, the vector of errors is $(X\beta - y)$. The sum of the squares of these errors can be expressed as the dot product of the error vector with itself:
\[(X\beta - y)^T (X\beta - y)\]So, the cost function in matrix form is:
\[J(\beta) = \frac{1}{2m} (X\beta - y)^T (X\beta - y)\]Minimizing the Cost Function
To find the value of $\beta$ that minimizes $J(\beta)$, we need to find the point where the gradient of $J(\beta)$ with respect to $\beta$ is the zero vector.
\[\nabla_\beta J(\beta) = 0\]Let’s first expand the cost function:
\[J(\beta) = \frac{1}{2m} ((X\beta)^T - y^T) (X\beta - y)\] \[J(\beta) = \frac{1}{2m} (\beta^T X^T - y^T) (X\beta - y)\] \[J(\beta) = \frac{1}{2m} (\beta^T X^T X \beta - \beta^T X^T y - y^T X \beta + y^T y)\]A key point here is that $\beta^T X^T y$ is a scalar, so its transpose is equal to itself: $(\beta^T X^T y)^T = y^T (X^T)^T (\beta^T)^T = y^T X \beta$. Therefore, the two middle terms are identical.
\[J(\beta) = \frac{1}{2m} (\beta^T X^T X \beta - 2y^T X \beta + y^T y)\]Now, we compute the gradient of $J(\beta)$ with respect to $\beta$. We use the following matrix calculus identities:
- $\nabla_\beta (\beta^T A \beta) = 2A\beta$ (for symmetric A, and $X^TX$ is symmetric)
- $\nabla_\beta (c^T \beta) = c$
Applying these rules to our cost function:
\[\nabla_\beta J(\beta) = \frac{1}{2m} (2X^T X \beta - 2X^T y + 0)\] \[\nabla_\beta J(\beta) = \frac{1}{m} (X^T X \beta - X^T y)\]The Normal Equation
Set the gradient to zero to find the minimum:
\[\frac{1}{m} (X^T X \beta - X^T y) = 0\] \[X^T X \beta - X^T y = 0\] \[X^T X \beta = X^T y\]This final expression is the Normal Equation. Its solution is the OLS estimate, written $\hat{\beta}$ to distinguish it from a generic candidate vector $\beta$. Multiplying both sides by the inverse of $(X^T X)$:
\[\hat{\beta} = (X^T X)^{-1} X^T y\]This equation gives a direct, analytical solution for the estimate $\hat{\beta}$, provided that the matrix $(X^T X)$ is invertible. If $(X^T X)$ is not invertible (i.e., it is singular), it could be due to redundant features (linear dependence) or having more features than training examples. In such cases, techniques like regularization can be used.
2. Why OLS Estimators Are BLUE
Why is Ordinary Least Squares - the method behind the normal equation - so widely trusted in statistics and econometrics? The answer is a theorem.
The estimators from OLS regression are called BLUE (Best Linear Unbiased Estimators). The reason the coefficients from the normal equation are considered “best unbiased estimators” is formally established by the Gauss-Markov Theorem.
This theorem states that under a specific set of assumptions, the OLS estimator is BLUE, which stands for:
- Best
- Linear
- Unbiased
- Estimator
Let’s break down each of these components to understand the full picture.
The Linear Model and its Assumptions
First, we need to define the linear regression model and the assumptions under which the Gauss-Markov theorem holds. The model is:
\[y = X\beta + \epsilon\]Where:
- y is the vector of observed dependent variables.
- X is the matrix of independent variables (our data).
- β is the vector of true, unobservable population coefficients (what we want to estimate).
- ϵ (epsilon) is the vector of unobservable error terms.
The OLS estimator for β, which is derived from the normal equation, is denoted as $\hat{\beta}$:
\[\hat{\beta} = (X^T X)^{-1} X^T y\]The Gauss-Markov theorem requires the following assumptions, stated conditionally on the design matrix $X$ - the modern convention, because it makes precise what each assumption claims at every configuration of the features:
Linearity / correct specification: The data-generating process really is $y = X\beta + \epsilon$, linear in the parameters.
Full column rank: No column of $X$ is an exact linear combination of the others, so $X^T X$ is invertible and the OLS solution is unique. (Part 2 explores what happens when this fails.)
Conditional zero mean (strict exogeneity): $E[\epsilon \mid X] = 0$. On average the errors vanish at every value of the features - a stronger and cleaner statement than merely requiring $Cov(X, \epsilon) = 0$, which it implies.
Spherical errors: $Var(\epsilon \mid X) = \sigma^2 I$. This packs two claims into one matrix statement: constant error variance for every observation (homoscedasticity, the diagonal), and zero correlation between the errors of different observations (no autocorrelation, the off-diagonal).
One assumption is conspicuously absent: normality. Gauss-Markov never asks for normally distributed errors - OLS is BLUE without them. Normality earns its keep elsewhere: it makes the exact small-sample $t$- and $F$-tests valid. Without it, inference leans on asymptotic (large-sample) results instead.
Now, let’s see how these assumptions lead to the OLS estimator being BLUE.
L: Linear Estimator
This is the most straightforward part. An estimator is linear if it is a linear function of the dependent variable, y.
Looking at the OLS formula, $\hat{\beta} = (X^T X)^{-1} X^T y$, we can see that $\hat{\beta}$ is calculated by matrix-multiplying y by a matrix of constants (since X is considered fixed data). This fits the definition of a linear estimator.
U: Unbiased Estimator
An estimator is unbiased if its expected value is equal to the true population parameter it is trying to estimate. In other words, if we were to repeat our experiment many times, the average of our estimated coefficients would be the true coefficient. We want to show that $E[\hat{\beta}] = \beta$.
Derivation of Unbiasedness:
Start with the formula for $\hat{\beta}$:
\[\hat{\beta} = (X^T X)^{-1} X^T y\]Substitute the true model, $y = X\beta + \epsilon$:
\[\hat{\beta} = (X^T X)^{-1} X^T (X\beta + \epsilon)\]Distribute the terms:
\[\hat{\beta} = (X^T X)^{-1} X^T X\beta + (X^T X)^{-1} X^T \epsilon\]Since $(X^T X)^{-1} (X^T X)$ is the identity matrix ($I$), this simplifies to:
\[\hat{\beta} = I\beta + (X^T X)^{-1} X^T \epsilon = \beta + (X^T X)^{-1} X^T \epsilon\]Now, take the expected value of both sides, conditioning on $X$. By the conditional zero mean assumption ($E[\epsilon \mid X] = 0$), the expectation of the second term vanishes:
\[E[\hat{\beta}] = E[\beta] + E[(X^T X)^{-1} X^T \epsilon]\] \[E[\hat{\beta}] = \beta + (X^T X)^{-1} X^T E[\epsilon]\] \[E[\hat{\beta}] = \beta + (X^T X)^{-1} X^T \cdot 0\] \[E[\hat{\beta}] = \beta\]
This proves that the OLS estimator is unbiased.
B: Best (Minimum Variance)
“Best” in the context of the Gauss-Markov theorem means that the OLS estimator has the minimum variance among all other linear unbiased estimators. This is the efficiency property.
A lower variance means that the estimates of the coefficients are more precise and less spread out over repeated samples. The Gauss-Markov theorem proves that no other linear and unbiased estimator can have a smaller variance than the OLS estimator.
The variance of the OLS estimator is given by: $Var(\hat{\beta}) = \sigma^2 (X^T X)^{-1}$ (derived from the spherical-errors assumption $Var(\epsilon \mid X) = \sigma^2 I$).
The proof of the “best” property involves showing that for any other linear unbiased estimator, say $\tilde{\beta}$, its variance will be greater than or equal to the variance of the OLS estimator $\hat{\beta}$. It demonstrates that the difference $Var(\tilde{\beta}) - Var(\hat{\beta})$ is a positive semi-definite matrix, meaning the OLS variance is smaller.
Summary
The coefficients obtained from the normal equation are the “best unbiased estimators” not inherently, but as a consequence of the Gauss-Markov theorem. When the assumptions of this theorem hold, the OLS estimator for $\beta$ is guaranteed to be:
- Linear: A linear function of the observed y.
- Unbiased: On average, it will correctly estimate the true population parameter β.
- Best: It has the smallest variance of all possible linear unbiased estimators, making it the most efficient and precise.
3. Why Normal Errors Imply a Normal Conditional Response
What do normally distributed errors imply about the response $y$? The answer follows from one property of normal random variables - but it is a statement about the conditional distribution of $y$ for fixed features, and keeping that qualifier explicit avoids a common misconception. For a fixed feature vector, $y$ is a constant plus a normal random variable, which is again normal.
Let’s break it down.
The Linear Regression Equation
The equation for a linear regression model is:
\[y = (\beta_0 + \beta_1X_1 + \dots + \beta_pX_p) + \epsilon\]For any given observation with specific feature values ($X_1, X_2, \dots$), we can split this equation into two parts:
The Deterministic Part: $(\beta_0 + \beta_1X_1 + \dots + \beta_pX_p)$ For a fixed set of inputs and learned coefficients, this part of the equation calculates to a single, constant value. This is the model’s prediction, often written as $\hat{y}$.
The Stochastic (Random) Part: $\epsilon$ This is the error term, which is assumed to be a random variable drawn from a normal distribution, typically with a mean of 0 and a variance of $\sigma^2$. We write this as $\epsilon \sim N(0, \sigma^2)$.
So, we can simplify the equation to:
\[y = \text{Constant} + \text{Normal Random Variable}\]The Key Mathematical Property
A core property of normal distributions is that if we add a constant to a normally distributed random variable, the resulting new variable is also normally distributed.
Adding a constant simply shifts the mean of the distribution, it does not change its shape (the variance) or its type.
Example: If we have a random variable $\epsilon \sim N(0, \sigma^2)$, and we add a constant C to it, the new variable $y = C + \epsilon$ will follow a new normal distribution: $y \sim N(C, \sigma^2)$. The distribution is just shifted so that its center is now at C instead of 0.
Putting It Together
Since our output y is the sum of the deterministic part (a constant for a given observation) and the error term $\epsilon$ (a normal random variable), y inherits its distributional shape directly from $\epsilon$.
- The conditional distribution of $y$ is normal: $y \mid X = x \sim \mathcal{N}(x^T\beta, \sigma^2)$ - a shifted version of the normal distribution of $\epsilon$.
- The conditional mean is the deterministic part, $E[y \mid X] = \beta_0 + \beta_1X_1 + \dots$.
- The conditional variance is the error variance, $Var(y \mid X) = \sigma^2$.
Therefore normal errors ensure that $y$ is normally distributed around the regression line - that is, conditionally on the features.
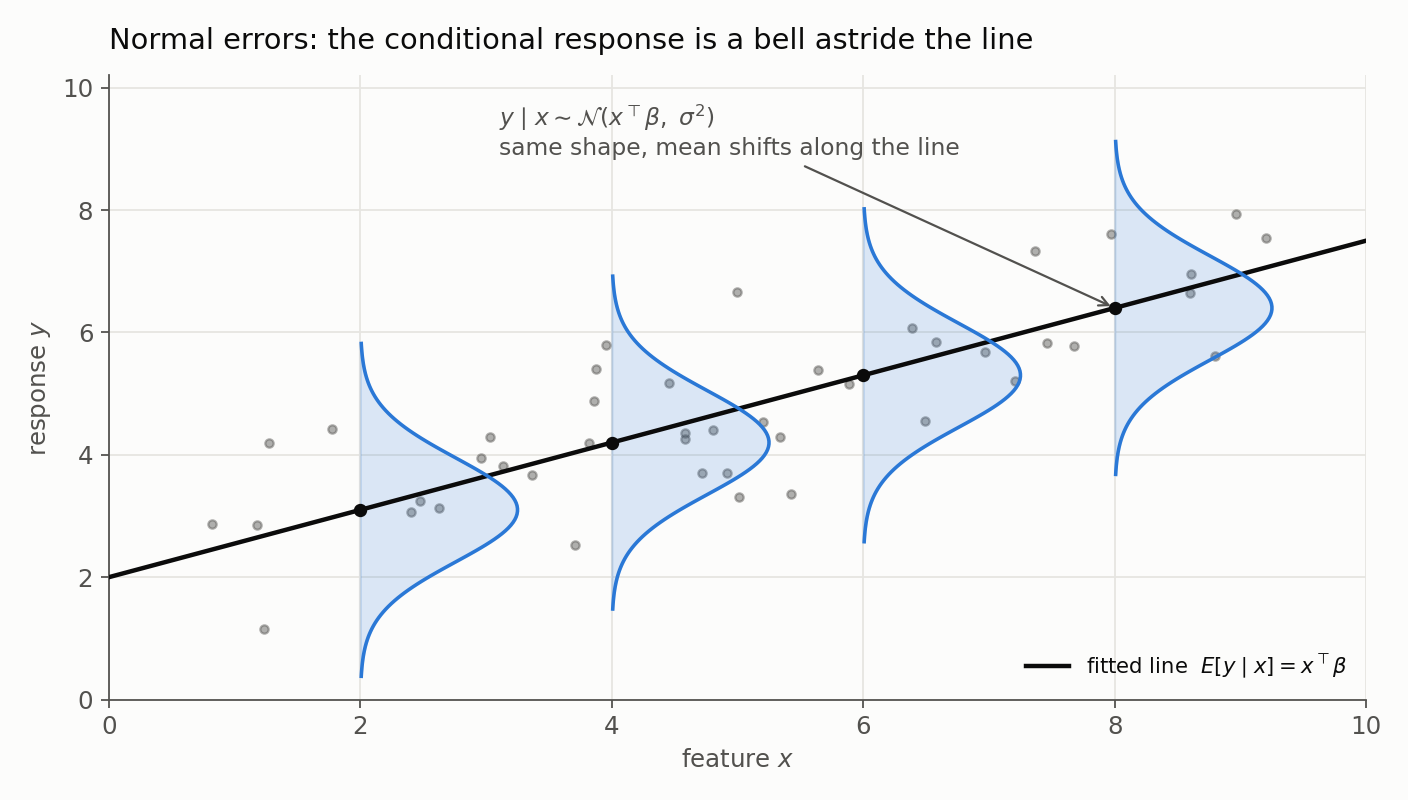
The picture makes the qualifier concrete: at each feature value the response is a bell centred on the line, and every bell has the same width $\sigma$ - only its mean slides along the line as $x$ changes.
One distinction keeps this honest: nothing above says the marginal distribution of $y$ is normal. When $X$ itself is random, the marginal distribution of $y$ is a mixture of these conditional normals across the feature distribution, and a mixture of normals with different means is generally not normal. A histogram of raw house prices can be heavily skewed even when the regression’s error term is perfectly Gaussian - so checking a histogram of $y$ for normality is the wrong diagnostic. The residuals are the right place to look.
4. Does Duplicating the Dataset Change the Coefficients?
This question gets to the heart of how linear regression models are calculated.
The direct answer is: No, the values of the coefficients themselves will not change.
However, and this is a critical point, the statistical measures of confidence about those coefficients (like standard errors and p-values) will change, making the model appear more statistically significant than it actually is.
Let’s break down why this happens for both of the main solving methods.
1. The Mathematical Proof (Using the Normal Equation)
The Normal Equation provides a direct, closed-form solution for the estimated coefficients ($\hat{\beta}$):
\[\hat{\beta} = (X^T X)^{-1} X^T y\]Let’s see what happens when we duplicate the entire dataset.
- Let the original feature matrix be $X$ (with $m$ rows) and the target vector be $y$.
- The new, duplicated feature matrix, $X_{new}$, is simply the original matrix stacked on top of itself. The same applies to the new target vector, $y_{new}$.
Now, let’s calculate the components of the new normal equation:
First Component: $X_{new}^T X_{new}$
\[X_{new}^T X_{new} = \begin{pmatrix} X^T & X^T \end{pmatrix} \begin{pmatrix} X \\ X \end{pmatrix} = (X^T X + X^T X) = 2(X^T X)\]Second Component: $X_{new}^T y_{new}$
\[X_{new}^T y_{new} = \begin{pmatrix} X^T & X^T \end{pmatrix} \begin{pmatrix} y \\ y \end{pmatrix} = (X^T y + X^T y) = 2(X^T y)\]Now, we plug these new components back into the normal equation formula to find the new estimate, $\hat{\beta}_{new}$:
\[\hat{\beta}_{new} = (X_{new}^T X_{new})^{-1} (X_{new}^T y_{new})\] \[\hat{\beta}_{new} = (2(X^T X))^{-1} (2(X^T y))\]Using the matrix inverse property $(cA)^{-1} = \frac{1}{c}A^{-1}$, we can pull the scalar 2 out of the inverse:
The scalars $\frac{1}{2}$ and $2$ cancel each other out:
\[\hat{\beta}_{new} = (X^T X)^{-1} (X^T y)\]This is the exact same formula as the original $\hat{\beta}$. Therefore, the coefficients do not change.
2. The Intuitive Explanation (Using Gradient Descent)
For solvers that use gradient descent, the logic is just as clear.
- The Cost Function: The Mean Squared Error (MSE) is calculated as $J(\beta) = \frac{1}{m} \sum (y_i - \hat{y}_i)^2$. When we duplicate the data, the number of data points becomes $2m$, and the sum of squared errors also exactly doubles. The
2in the numerator and the2in the denominator cancel out, leaving the cost function’s value identical for any given candidate $\beta$. - The Gradient: The gradient (the direction of the steepest ascent) at any point on the cost surface is also calculated by averaging over the data points. Since we have just duplicated the data, the average gradient at any point $\beta$ remains exactly the same.
Because the shape of the cost surface is identical and the gradient at every point is identical, the path gradient descent takes to find the minimum will also be identical. It will converge to the same solution.
Does the Same Hold Under Regularization?
Mostly - but it depends on bookkeeping:
- If the loss is averaged over rows (the MSE form above) and the same $\lambda$ is used, duplicating every row leaves the optimum unchanged: the data term and the penalty are both untouched.
- If the loss is summed while the penalty $\lambda \sum \beta_j^2$ stays fixed, duplication doubles the data term but not the penalty. The penalty becomes relatively half as strong, and the coefficients drift toward the unregularized solution.
- With stochastic training (mini-batch order, early stopping, nondeterministic parallelism), numerical results can differ even when the mathematical optimum is identical.
Libraries differ on which convention they use - so “duplicating rows changed my Ridge coefficients” is a bookkeeping observation, not a contradiction of the math above.
The Critical Caveat: What Does Change?
This is the most important part. While the coefficient values stay the same, we have not actually added any new information to the model. However, the statistical formulas that calculate the certainty of our estimates don’t know this.
- Standard Errors will Decrease: The standard error of a coefficient measures its uncertainty. The formula for the variance-covariance matrix of the coefficients is $Var(\hat{\beta}) = \sigma^2 (X^T X)^{-1}$. Since the new $X_{new}^T X_{new}$ is $2(X^T X)$, the new variance will be halved, and the standard error will decrease by a factor of $\sqrt{2}$.
- P-values will Decrease: With smaller standard errors, the t-statistics for the coefficients will be larger, leading to much smaller p-values.
- Confidence Intervals will Narrow: The confidence intervals around the coefficient estimates will become narrower.
In short, duplicating the data is statistically deceptive. It makes the model look much more precise and statistically significant than it really is. We are tricking the model into believing it has twice the amount of evidence, when in reality it has just seen the same evidence twice. This is a form of pseudo-replication and is considered a serious methodological error in statistics.
| What Stays the Same | What Changes (Artificially) |
|---|---|
| Coefficient values ($\hat{\beta}_j$) | Standard Errors (Decrease) |
| R-squared value | P-values (Decrease) |
| Model predictions for a given input | Confidence Intervals (Narrow) |
| Mean Squared Error (MSE) | Overall Statistical Significance (Inflates) |
5. What If $X^T X$ Is Not Invertible?
This is a critical issue in practical applications of linear regression. When the matrix $X^T X$ is not invertible (it is singular or ill-conditioned), the normal equation $\hat{\beta} = (X^T X)^{-1} X^T y$ cannot be solved directly because the inverse $(X^T X)^{-1}$ does not exist. This situation indicates that there isn’t a unique coefficient vector minimizing the cost function.
Here’s a breakdown of why this happens and what our options are, including the use of the Moore-Penrose pseudoinverse.
Why is $X^T X$ Not Invertible?
There are two primary reasons for $X^T X$ being non-invertible:
Multicollinearity: This occurs when two or more of the independent variables (the columns of matrix $X$) are highly correlated. In the case of perfect multicollinearity, one feature is an exact linear combination of one or more other features. For example, if we have a feature for temperature in Celsius and another for temperature in Fahrenheit, they are perfectly correlated, and $X^T X$ will be singular.
More Features than Data Points: If the number of features ($n$) is greater than the number of data points ($m$), the system is “under-determined.” There are infinitely many solutions that can perfectly fit the data, and thus no unique solution can be found. In this scenario, the columns of $X$ are guaranteed to be linearly dependent, making $X^T X$ non-invertible.
What are the Options?
When faced with a non-invertible $X^T X$ matrix, we have several options. The choice depends on the underlying cause of the problem.
Option 1: Feature Selection and Engineering
If the issue is multicollinearity, the most straightforward approach is to address it directly:
- Remove Redundant Features: Identify the highly correlated features and remove one from each correlated group. For instance, if we have features for both the total number of rooms and the number of bedrooms, these are likely to be highly correlated. We could choose to keep only one.
- Combine Features: Instead of removing features, we can combine them into a single, more representative feature. For example, we could create a new feature that is a weighted average of the correlated features.
Option 2: Regularization
Regularization is a technique used to prevent overfitting and can also solve the problem of a non-invertible $X^T X$. It involves adding a penalty term to the cost function, which in turn adds a term to the $X^T X$ matrix, making it invertible.
The most common form of regularization for this purpose is Ridge Regression (L2 Regularization). The modified normal equation is:
\[\hat{\beta} = (X^T X + \lambda I)^{-1} X^T y\]Here:
- $I$ is the identity matrix.
- $\lambda$ (lambda) is the regularization parameter, a positive scalar.
By adding a small positive value ($\lambda$) to the diagonal elements of $X^T X$, we ensure that the resulting matrix is always invertible. (One practical convention to note: the intercept is usually not penalized. Implementations either center the data first or use a penalty matrix whose intercept entry is zero, so the “add $\lambda$ to every diagonal element” picture applies to the feature block, not the intercept.) This method introduces a small amount of bias into the model to significantly reduce the variance and provide a unique, stable solution.
Option 3: Use the Moore-Penrose Pseudoinverse
Yes, we can absolutely use the Moore-Penrose pseudoinverse when $X^T X$ is not invertible. This is a more direct mathematical solution.
The Moore-Penrose pseudoinverse, denoted by a superscript plus sign ($+$), is a generalization of the matrix inverse for non-square or singular matrices. The normal equation solution using the pseudoinverse is:
\[\hat{\beta} = (X^T X)^+ X^T y\]What does the pseudoinverse do?
When the normal equation has a unique solution (i.e., $X^T X$ is invertible), the pseudoinverse is identical to the regular inverse: $(X^T X)^+ = (X^T X)^{-1}$. However, when there are infinitely many solutions, the Moore-Penrose pseudoinverse provides a unique solution that has the smallest Euclidean norm ($\lVert \beta \rVert_2$). This means that among all coefficient vectors $\beta$ that minimize the sum of squared errors, it picks the one with the smallest magnitude. This is often a desirable property as it tends to favor simpler models with smaller coefficient values, which can help prevent overfitting.
Many numerical computing libraries, such as NumPy in Python (numpy.linalg.pinv), provide functions to compute the pseudoinverse directly.
A related practical rule: even when $X^T X$ is invertible, production code should not compute $(X^T X)^{-1}$ explicitly. Forming $X^T X$ squares the condition number of the problem, amplifying numerical error. Solve the least-squares system directly via QR or SVD - numpy.linalg.lstsq in NumPy, or any library estimator - which is exactly what those implementations do internally.
Summary of Options
| Method | When to Use | What it Does |
|---|---|---|
| Feature Selection | Multicollinearity is present and we want a simpler, more interpretable model. | Reduces the number of features to eliminate linear dependencies. |
| Regularization (Ridge) | We want to keep all features and obtain a stable, unique solution. | Adds a penalty term to ensure the matrix is invertible, shrinking coefficient values. |
| Moore-Penrose Pseudoinverse | We need a direct analytical solution when an inverse doesn’t exist. | Finds the unique solution with the minimum Euclidean norm among all possible solutions. |
In practice, regularization is often the preferred method in machine learning because it is robust, computationally stable, and helps to build models that generalize better to new data. The Moore-Penrose pseudoinverse is a powerful mathematical tool that is also a perfectly valid and effective solution.
Resources
We now know where the closed-form OLS solution comes from, which guarantees it carries, and where it becomes unstable. Part 2 follows that instability into multicollinearity and develops the Ridge, Lasso, and Elastic Net responses.