Boosting, Part 1: AdaBoost and Gradient Boosting
Boosting series: Part 1: AdaBoost and Gradient Boosting · Part 2: The XGBoost Mathematics · Part 3: Choosing a Library
Boosting answers a deceptively simple question: can a committee of weak learners, each barely better than a coin flip, add up to one strong model? This series works through the answer. Part 1 covers the two foundational algorithms - AdaBoost, which reweights hard examples, and gradient boosting, which reframes the whole thing as gradient descent in function space. Part 2 derives the XGBoost mathematics; Part 3 compares the modern libraries.
1. The Core Idea: What is Boosting?
Motivation The high-level motivation behind boosting is to answer a simple question: “Can a set of weak learners create a single strong learner?” A weak learner is a model that performs just slightly better than random guessing (e.g., a short decision tree or “stump”). Instead of trying to build one massive, complex model that might overfit, boosting combines many simple models to create an ensemble that is both accurate and robust.
Why is it called “Boosting”? It is called “boosting” because the algorithm sequentially “boosts” the performance of the ensemble. It does this by focusing on the mistakes of previous models. If a data point was misclassified, the next model in the sequence pays more attention to it. This iterative improvement boosts the overall accuracy of the final prediction.
Bagging vs. Boosting While both are ensemble methods, they approach the problem differently. Here is a comparison highlighting the key differences:
| Aspect | Bagging (e.g., Random Forest) | Boosting (e.g., XGBoost, AdaBoost) |
|---|---|---|
| Training Approach | Parallel: Weak learners are trained independently at the same time. | Sequential: Each learner is trained to correct the errors of the previous one. |
| Objective | Reduces Variance: Great for stabilizing high-variance models (like deep trees). | Reduces Bias: Great for improving high-bias models (like shallow stumps). |
| Weak Learners | Deep decision trees (High Variance). | Shallow decision trees/Stumps (High Bias). |
| Data Sampling | Bootstrap sampling (random subsets with replacement). | Full dataset, but weighted by errors (focus on misclassified). |
| Overfitting Risk | Lower: Independent trees reduce overfitting. | Higher: The sequential focus on errors can lead to overfitting if not stopped early. |
This table is a useful first cut, but each row has exceptions worth stating. Bagging mainly cuts variance while boosting mainly cuts bias, yet boosting affects variance too, and neither is universally more prone to overfitting. Only classic AdaBoost literally reweights misclassified rows; gradient boosting fits negative loss gradients, which need not coincide with misclassifications, and stochastic variants subsample rows and columns rather than always using the full dataset. And while boosting rounds are sequential, the work inside a round (split search, histogram building, data loading) still parallelizes.
2. Why Learn AdaBoost, Gradient Boosting, and XGBoost?
Understanding these three algorithms traces three influential stages in the evolution of tree boosting:
- AdaBoost (Adaptive Boosting): The foundational practical adaptive boosting algorithm (Freund & Schapire, mid-1990s). Earlier theoretical boosting procedures preceded it, but AdaBoost introduced the concrete recipe of updating sample weights to punish errors.
- Gradient Boosting: A generalization of AdaBoost. Instead of just updating weights, it frames boosting as an optimization problem where new models predict the gradients (direction of error) of a loss function.
- XGBoost (Extreme Gradient Boosting): An optimized, scalable, regularized gradient-boosting library. It is one of the most widely used tree-boosting systems for tabular data, adding systems engineering (cache awareness, sparsity handling) and second-order optimization.
3. AdaBoost (Adaptive Boosting)
High-Level Motivation AdaBoost solves classification problems by assigning weights to every data point. Initially, all weights are equal. After every round, the weights of misclassified points are increased and those of correctly classified points decreased. The next learner minimizes weighted error, so those high-weight points carry more influence in its split search - though a weak learner may still misclassify some of them.
Toy Dataset Let’s predict a binary target (+1 or -1) for 10 records. The columns are synthetic and chosen only to make the arithmetic clean; this is not a medically meaningful model. Note that we deliberately call the numeric feature Body_Weight_kg rather than “weight” so it is never confused with the AdaBoost sample weights $w_i$.
| ID | Chest_Pain | Blocked_Arteries | Body_Weight_kg | Target |
|---|---|---|---|---|
| 1 | Yes | Yes | 205 | Yes (+1) |
| 2 | No | Yes | 180 | Yes (+1) |
| 3 | Yes | No | 210 | Yes (+1) |
| 4 | Yes | Yes | 167 | Yes (+1) |
| 5 | No | Yes | 156 | No (-1) |
| 6 | No | Yes | 125 | No (-1) |
| 7 | Yes | No | 168 | No (-1) |
| 8 | Yes | Yes | 111 | No (-1) |
| 9 | No | No | 130 | No (-1) |
| 10 | No | No | 150 | No (-1) |
Step-by-Step Classification Algorithm
Throughout, $\log$ is the natural logarithm, and both the labels $y_i$ and the stump outputs $h_t(x_i)$ live in $\{-1, +1\}$.
Step 1: Initialize Weights Assign equal weight to all $N=10$ samples: $w_i^{(1)} = 1/N = 0.1$.
- Step 2: Build the First Stump AdaBoost scores every candidate stump (each binary feature, and each midpoint threshold on
Body_Weight_kg) by its weighted error $\epsilon = \sum_{i:\, h(x_i)\neq y_i} w_i$, and keeps the smallest. Two thresholds tie for best on this data:- $h_1$:
Body_Weight_kg > 161.5predicts $+1$, else $-1$. It misclassifies only Record 7, so $\epsilon_1 = 0.1$. Body_Weight_kg > 174also gives $\epsilon = 0.1$ (missing Record 4 instead). We break the tie toward the first.
The tempting
Blocked_Arteries = Yessplit is actually poor here: it errs on Records 3, 5, 6, and 8, for $\epsilon = 0.4$. A required condition is that the stump beat chance, $\epsilon < 0.5$; if $\epsilon \ge 0.5$ the round is rejected, and if $\epsilon = 0$ training stops (the next formula would divide by zero). - $h_1$:
Step 3: Amount of Say ($\alpha$)
\[\alpha_1 = \frac{1}{2}\log\frac{1-\epsilon_1}{\epsilon_1} = \frac{1}{2}\log\frac{0.9}{0.1} = \frac{1}{2}\log 9 \approx 1.099.\]Lower error gives higher $\alpha$, hence more say.
Step 4: Update the Weights A single rule handles both correct and incorrect points:
\[w_i^{(2)} = \frac{w_i^{(1)}\exp[-\alpha_1\, y_i\, h_1(x_i)]}{Z_1},\]where $Z_1$ normalizes the new weights to sum to 1. For a correct point $y_i h_1(x_i) = +1$, so its weight is scaled by $e^{-\alpha_1}$; for the one mistake $y_i h_1(x_i) = -1$, so it is scaled by $e^{+\alpha_1}$. Here $Z_1 = 0.6$, giving:
- Record 7 (the mistake): $w^{(2)} = 0.5$.
- Each of the other nine records: $w^{(2)} \approx 0.0556$.
Record 7 now carries half the total weight.
Step 5: Build the Second Stump Re-scoring the candidates under the new weights, the best stump is now
Body_Weight_kg > 174, with weighted error $\epsilon_2 \approx 0.0556$ and say $\alpha_2 = \tfrac{1}{2}\log\frac{1-0.0556}{0.0556} \approx 1.417$. This is the point of the whole exercise: the threshold has moved to classify the heavily-weighted Record 7 correctly (now missing only Record 4). The re-weighting did exactly its job.Step 6: Repeat Iterate Steps 2-5 for $M$ rounds (e.g., 50 stumps), re-weighting and re-scoring each time.
Step 7: Final Prediction Each stump votes, weighted by its say:
\[H(x) = \operatorname{sign}\!\left(\sum_{t=1}^{M} \alpha_t\, h_t(x)\right).\]A positive sum predicts $+1$, a negative sum predicts $-1$. This stagewise procedure is exactly greedy minimization of the exponential loss $\sum_i \exp[-y_i \sum_t \alpha_t h_t(x_i)]$, which is where the $\alpha$ and weight-update formulas come from.
AdaBoost for Regression: AdaBoost.R2
The regression variant below is AdaBoost.R2 (Drucker, 1997), not a trivial sign-flip of the classification equations. A few details are specific to it: the per-sample loss can use a linear, squared, or exponential transform; the normalized average loss must be checked (the round stops if it reaches 0.5); implementations may either resample by weight or pass sample weights to the base learner; and the final prediction is a weighted median, not a mean.
- Step 1: Initialization: Initialize weights $w_i = 1/N$.
- Step 2: Build Learner: Train a weak learner $h_t(x)$ on the weighted dataset.
Step 3: Calculate Prediction Error: Calculate the loss for each point (e.g., linear loss):
\[L_i = \frac{\lvert y_i - h_t(x_i) \rvert}{D_t}\]where $D_t$ is the max error defined by: $D_t = \max_{i} \lvert y_i - h_t(x_i) \rvert$
Calculate average loss $\bar{L} = \sum w_i L_i$.
- Step 4: Calculate Alpha: Measure confidence (beta) $\beta_t = \frac{\bar{L}}{1-\bar{L}}$. Amount of say $\alpha_t = \ln(1/\beta_t)$.
Step 5: Update Weights:
\[w_{i, new} = w_{i, old} \cdot \beta_t^{(1-L_i)}\](Weights decrease for good predictions, stay high for bad ones). Normalize weights.
- Step 6: Repeat: Iterate for T rounds.
- Step 7: Final Prediction: Unlike classification (sum), regression often uses a Weighted Median of the predictions from all learners, using $\alpha_t$ as the weights.
Regularization in AdaBoost AdaBoost’s primary regularization is the Learning Rate (Shrinkage). We multiply the alpha ($\alpha_t$) by a factor $\nu$ (e.g., 0.1). This reduces the impact of each tree, requiring more trees to build the model but improving generalization.
Pros and Cons
- Pros: Simple, rarely overfits on low-noise data, effectively reduces bias.
- Cons: Sensitive to label noise and outliers. Under exponential loss, a mislabeled or anomalous point can keep accumulating large weight round after round, pulling successive stumps toward it and degrading generalization.
4. Gradient Boosting
High-Level Motivation Gradient Boosting treats the learning process as a numerical optimization problem. Instead of re-weighting data points (like AdaBoost), it trains the next tree to predict the residual errors of the current ensemble. Mathematically, these residuals are the negative gradients of the loss function. It’s effectively performing Gradient Descent in “function space.”
Toy Dataset: Salary Prediction Predict Salary (in \$1000s) from years of experience, six records:
| ID | Years_Exp | Salary |
|---|---|---|
| 1 | 1 | 45 |
| 2 | 2 | 50 |
| 3 | 4 | 60 |
| 4 | 6 | 70 |
| 5 | 8 | 95 |
| 6 | 10 | 110 |
Regression Algorithm Step-by-Step
Step 1: Base Model (Initial Prediction) We find a constant value $\gamma$ that minimizes the sum of squared errors: $\sum (y_i - \gamma)^2$. Taking the derivative (gradient) w.r.t $\gamma$ and setting to 0 gives:
\[\sum -2(y_i - \gamma) = 0 \implies \gamma = \frac{1}{N}\sum y_i\]Result: The optimal first model is the Mean of the target values.
Step 2: Predict Pseudo-Residuals Why residuals? For Mean Squared Error Loss $L = \frac{1}{2}(y - F(x))^2$, the gradient with respect to the prediction $F(x)$ is:
\[\frac{\partial L}{\partial F(x)} = -(y - F(x))\]The negative gradient is $(y - F(x))$, which is simply the Residual. The algorithm calculates residuals $r_i = y_i - F_{prev}(x_i)$ and trains a decision tree to predict these $r_i$ values.
Step 3: Parallel with Neural Networks In Neural Nets, we update weights: $w_{new} = w_{old} - \eta \cdot \nabla L$. In Gradient Boosting, we update the model: $F_{new}(x) = F_{old}(x) + \eta \cdot h(x)$. Here, $h(x)$ is the tree predicting the negative gradient. $\eta$ is the learning rate (e.g., 0.1), which scales the tree’s contribution to prevent overfitting (over-correcting).
Step 4: Final Prediction
\[F_{final}(x) = \text{Mean} + \eta \cdot h_1(x) + \eta \cdot h_2(x) + \dots + \eta \cdot h_M(x)\]
A Worked Round (Squared Error)
Let’s run one full stage on the salary data with learning rate $\eta = 0.3$.
- Base model. $F_0 = \bar{y} = (45+50+60+70+95+110)/6 = 71.67$.
- Residuals ($y - F_0$): $-26.67,\, -21.67,\, -11.67,\, -1.67,\, +23.33,\, +38.33$.
- Fit a stump to the residuals. The best split is $\text{Years\_Exp} < 7$: the four junior records form one leaf (mean residual $-15.42$), the two senior ones the other (mean residual $+30.83$).
- Update $F_1 = F_0 + \eta \cdot (\text{leaf residual})$: juniors move to $71.67 + 0.3(-15.42) = 67.04$, seniors to $71.67 + 0.3(30.83) = 80.92$.
- New residuals shrink toward zero, e.g. Record 6 goes from $+38.33$ down to $+29.08$.
- Loss. The sum of squared errors falls from $3333$ to $1879$ - a 44% cut from one shrunken step. Because $\eta = 0.3$, the tree only moved the predictions part-way; dozens more small steps keep chipping the residuals down without over-correcting.
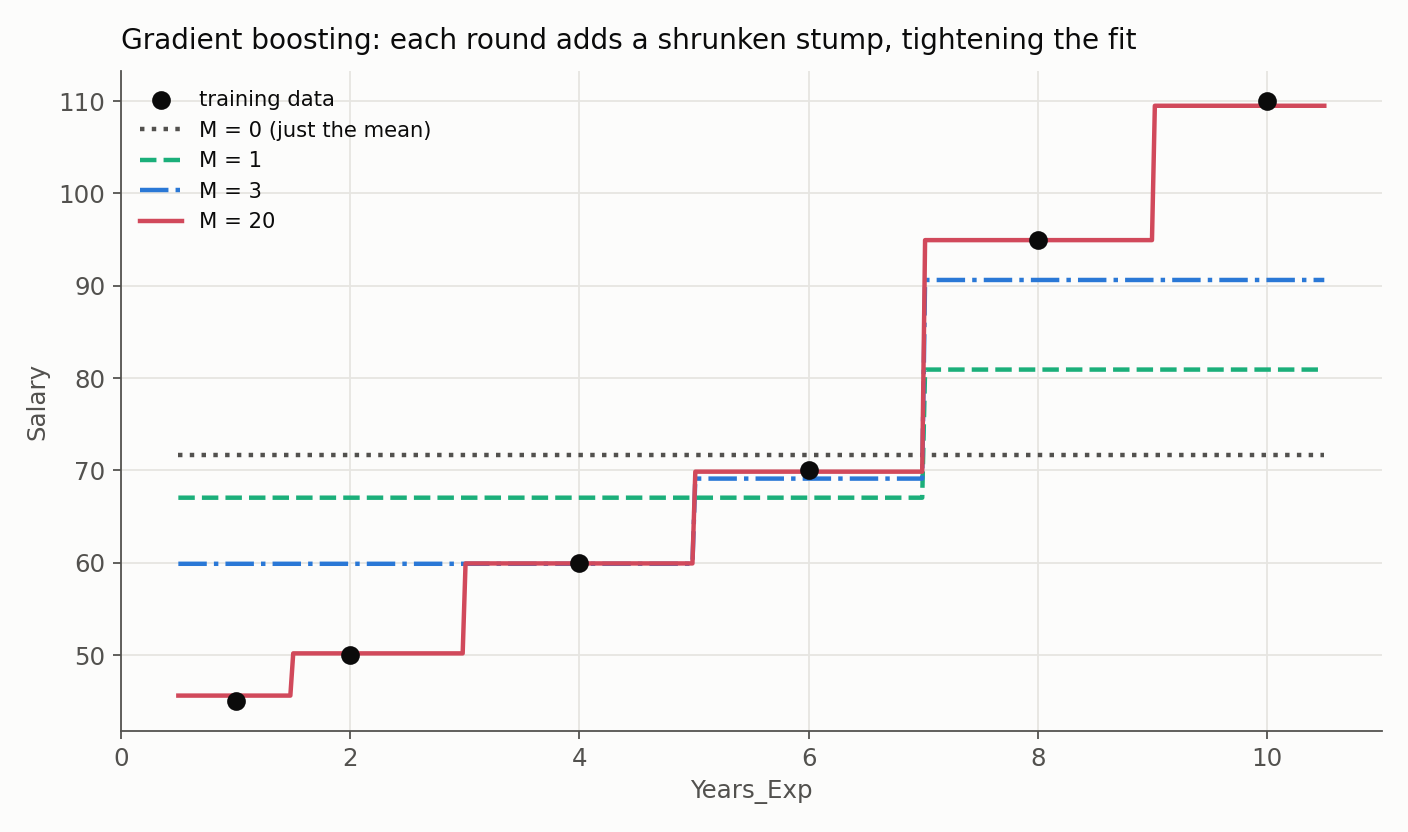
The picture shows exactly this process running to 20 rounds: the flat mean ($M=0$) becomes a coarse step ($M=1$), then a finer staircase that tightens onto the data as the shrunken stumps accumulate.
The General Stage (Any Differentiable Loss)
The steps above take a shortcut that is exact only for squared error. In the general algorithm (Friedman, 2001), a round has two distinct parts. First, fit a tree to the pseudo-residuals
\[r_{im} = -\left[\frac{\partial L(y_i, F(x_i))}{\partial F(x_i)}\right]_{F = F_{m-1}},\]which only fixes the tree’s structure (its terminal regions $R_{jm}$). Second, choose each leaf’s output value by directly minimizing the loss on the points in that leaf:
\[\gamma_{jm} = \arg\min_{\gamma} \sum_{x_i \in R_{jm}} L\!\left(y_i,\, F_{m-1}(x_i) + \gamma\right),\]and update $F_m(x) = F_{m-1}(x) + \nu \sum_j \gamma_{jm}\,\mathbf{1}(x \in R_{jm})$.
For squared error the leaf minimizer is exactly the mean residual, so the shortcut and the general rule agree - which is why the regression walk-through above is correct. For other losses (logistic below) they differ, and skipping the leaf optimization gives the wrong leaf values.
Binary Classification Algorithm (Math Formulation)
- Step 1: Base Model: Minimize Log-Loss $L = -\sum [y_i \ln(p) + (1-y_i) \ln(1-p)]$. Deriving w.r.t log-odds (log(p/(1-p))) gives the initial prediction as the log-odds of the target class frequency: $\ln(\frac{\text{num\_positive}}{\text{num\_negative}})$.
Step 2: Pseudo-Residuals (Chain Rule): We need $-\frac{\partial L}{\partial \text{log\_odds}}$. Using chain rule: $\frac{\partial L}{\partial p} \cdot \frac{\partial p}{\partial \text{log\_odds}}$.
Result: The negative gradient simplifies to $(y_i - p_i)$.
The next tree fits these “probability residuals” (Actual [0 or 1] - Predicted Probability).
Step 3: Leaf Values and Final Prediction: Fitting the tree to $(y_i - p_i)$ sets its structure, but each leaf’s output for the log-odds is a Newton step, not the raw residual mean:
\[\gamma_{\text{leaf}} = \frac{\sum_{i \in \text{leaf}} (y_i - p_i)}{\sum_{i \in \text{leaf}} p_i(1 - p_i)}.\]The final score accumulates the initial log-odds and the shrunken leaf outputs, then maps through the sigmoid:
\[P(y=1) = \sigma\!\left(F_0 + \nu \sum_{m=1}^{M} h_m(x)\right), \qquad F_0 = \log\frac{\bar{p}}{1 - \bar{p}},\]where $\bar{p}$ is the base rate of the positive class. (Different label/loss conventions can introduce factors of 2, so a derivation must fix one convention and hold it throughout.)
Regularization: Supports Learning Rate (Shrinkage), Subsampling (Stochastic Gradient Boosting), and tree constraints (max depth, min samples per leaf).
Why do we take gradients for individual points and not as a whole
- The Loss Function is a Sum
To understand why we look at individual rows, we look at the objective function. We want to minimize the total loss across $n$ data points:
\[J = \sum_{i=1}^{n} L(y_i, F(x_i))\]If we use Mean Squared Error (MSE), this is:
\[J = \sum_{i=1}^{n} \frac{1}{2}(y_i - F(x_i))^2\]- Gradient Descent in “Function Space”
In a typical model, we’d calculate $\frac{\partial J}{\partial w}$ to update weights. But in Gradient Boosting, we treat the prediction for each specific data point, $F(x_i)$, as the variable we want to “nudge” to reduce the loss.
Think of it this way: for a dataset with 100 rows, we have 100 separate “knobs” we can turn. Each knob $F(x_i)$ only affects the loss $L_i$ for that specific row.
- Calculating the Gradient (The “Direction”)
To find the best way to reduce the total loss $J$, we take the partial derivative with respect to each “knob”:
\[\frac{\partial J}{\partial F(x_i)} = \frac{\partial}{\partial F(x_i)} \left[ \sum_{j=1}^{n} L(y_j, F(x_j)) \right]\]Since $F(x_i)$ only appears in the $i$-th term of the sum, all other terms become zero. For MSE, this simplifies to:
\[\frac{\partial J}{\partial F(x_i)} = -(y_i - F(x_i))\]The negative gradient (the direction we want to move) is:
\[- \frac{\partial J}{\partial F(x_i)} = y_i - F(x_i)\]This is exactly the residual for that specific point.
- The Gradient Vector
Because we have $n$ data points, our gradient isn’t a single number; it’s a vector in $n$-dimensional space:
\[\vec{g} = \begin{bmatrix} y_1 - F(x_1) \\ y_2 - F(x_2) \\ \vdots \\ y_n - F(x_n) \end{bmatrix}\]- Why a Global Average Doesn’t Work
If we used a “global” residual (the average of all residuals), we would be moving every single $F(x_i)$ by the same amount.
- Global Level: “On average, the model is too low by 10 units. Let’s add 10 to every prediction.”
- Per-Datapoint Level: “Point A is too low by 50, but Point B is too high by 30. Let’s create a rule (a tree) that adds 50 to points like A and subtracts 30 from points like B.”
The power of Gradient Boosting comes from the fact that the next weak learner (the tree) is trained to map the features $X$ to these individual gradients. By looking at residuals per-row, the tree learns which regions of the feature space are being under-predicted or over-predicted.
One important nuance corrects the “100 knobs” picture: the tree cannot move all $n$ predictions independently. It approximates the gradient vector within a constrained function class, so every observation that lands in the same leaf receives the same increment. That coupling is exactly why the ensemble generalizes to unseen points (it learns regions, not per-row corrections) and why a single stage usually cannot drive every residual to zero.
Pros and Cons:
- Pros: Extremely flexible (works with any differentiable loss function), often higher accuracy than AdaBoost.
- Cons: Sequential training makes it harder to parallelize (slower than Random Forest), requires careful tuning of parameters.
That is the conceptual core of boosting. Part 2: The XGBoost Mathematics turns gradient boosting into a regularized, second-order optimization problem and derives the leaf weights and split gain that make XGBoost such a strong default for tabular data.
Resources
- Freund, Y. & Schapire, R. E. (1997). A Decision-Theoretic Generalization of On-Line Learning and an Application to Boosting. Journal of Computer and System Sciences, 55(1), 119-139. (AdaBoost.)
- Schapire, R. E. (1990). The Strength of Weak Learnability. Machine Learning, 5(2), 197-227.
- Drucker, H. (1997). Improving Regressors using Boosting Techniques. ICML 1997, 107-115. (AdaBoost.R2.)
- Friedman, J. H. (2001). Greedy Function Approximation: A Gradient Boosting Machine. The Annals of Statistics, 29(5), 1189-1232.