Understanding Bias-Variance Tradeoff
Bias and variance as properties of a learning procedure across datasets: the archery and house-price intuition, a repeated-fits simulation, the squared-error decomposition, and how to diagnose under- vs overfitting in practice.
The Concept: Bias, Variance, and the Tradeoff
The Bias-Variance Tradeoff is one of the most fundamental concepts in machine learning. It sits underneath a deceptively simple question: why does a model that scores brilliantly on its own training data so often stumble on new, unseen data? That gap - between training performance and generalization performance - is exactly what bias and variance are built to explain.
Let’s break it down conceptually, make it visual, and then walk through the math.
The Core Idea: An Archery Analogy
Imagine we are archers trying to hit the bullseye of a target. We take several shots.
Bias: Think of bias as a systematic error or a flaw in our aim.
- High Bias: We consistently miss the bullseye in the same direction. For example, all our shots land in the top-left corner. Our aim is consistently off.
- Low Bias: Our shots are centered around the bullseye. On average, we are hitting the target correctly.
Variance: Think of variance as how scattered our shots are. It measures the consistency of our aim.
- High Variance: Our shots are all over the place - some high, some low, some left, some right. Our aim is very inconsistent and unpredictable.
- Low Variance: All our shots are tightly clustered together. Our aim is very consistent.
The Four Scenarios
This gives us four possible outcomes:
- Low Bias, Low Variance (Ideal): We are accurate and consistent. All our shots land on the bullseye.
- High Bias, Low Variance (Underfitting): We are consistent, but consistently wrong. All our shots are clustered together but miss the bullseye.
- Low Bias, High Variance (Overfitting): We are accurate on average, but very inconsistent. Our shots are scattered all around the bullseye.
- High Bias, High Variance (Worst Case): We are inaccurate and inconsistent. Our shots are scattered and miss the bullseye.
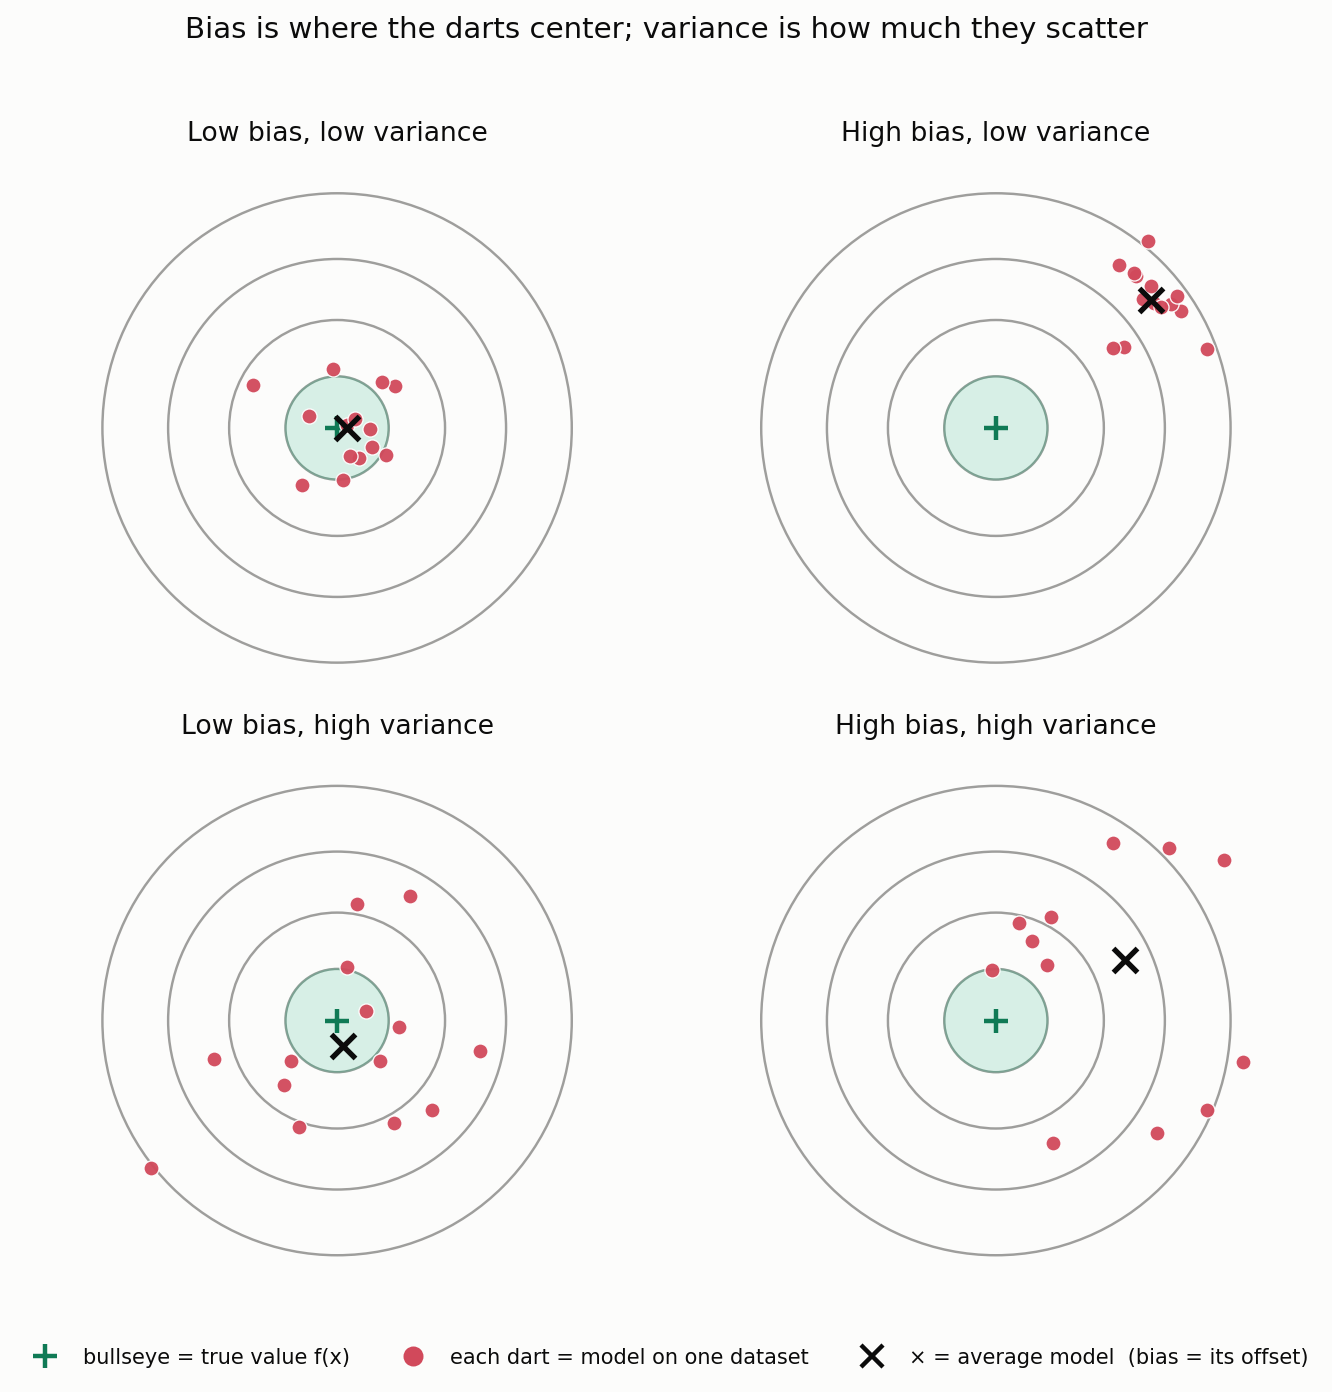
Reading the analogy correctly. One subtlety is worth pinning down, because it is the single most common misunderstanding. Picture the target at one fixed input $x$, where each arrow is a whole model trained on a different plausible dataset. The bullseye is the true value $f(x)$, not a single noisy observation. The center of the arrow cluster captures bias (how far the average model sits from the truth), and the spread of the cluster captures variance (how much the model jumps around as the training data changes). The measurement noise in any one real outcome is a separate thing layered on top. So variance here is not the scatter of residuals within one fitted model; it is the scatter of the fitted model itself across the datasets we might have trained on.
We can make this concrete by actually doing it: take one true curve, draw many small training sets from it, and fit models of increasing flexibility to each. The figure shows the fitted curves (thin blue), their average (red), and the truth (dashed) at three complexities:
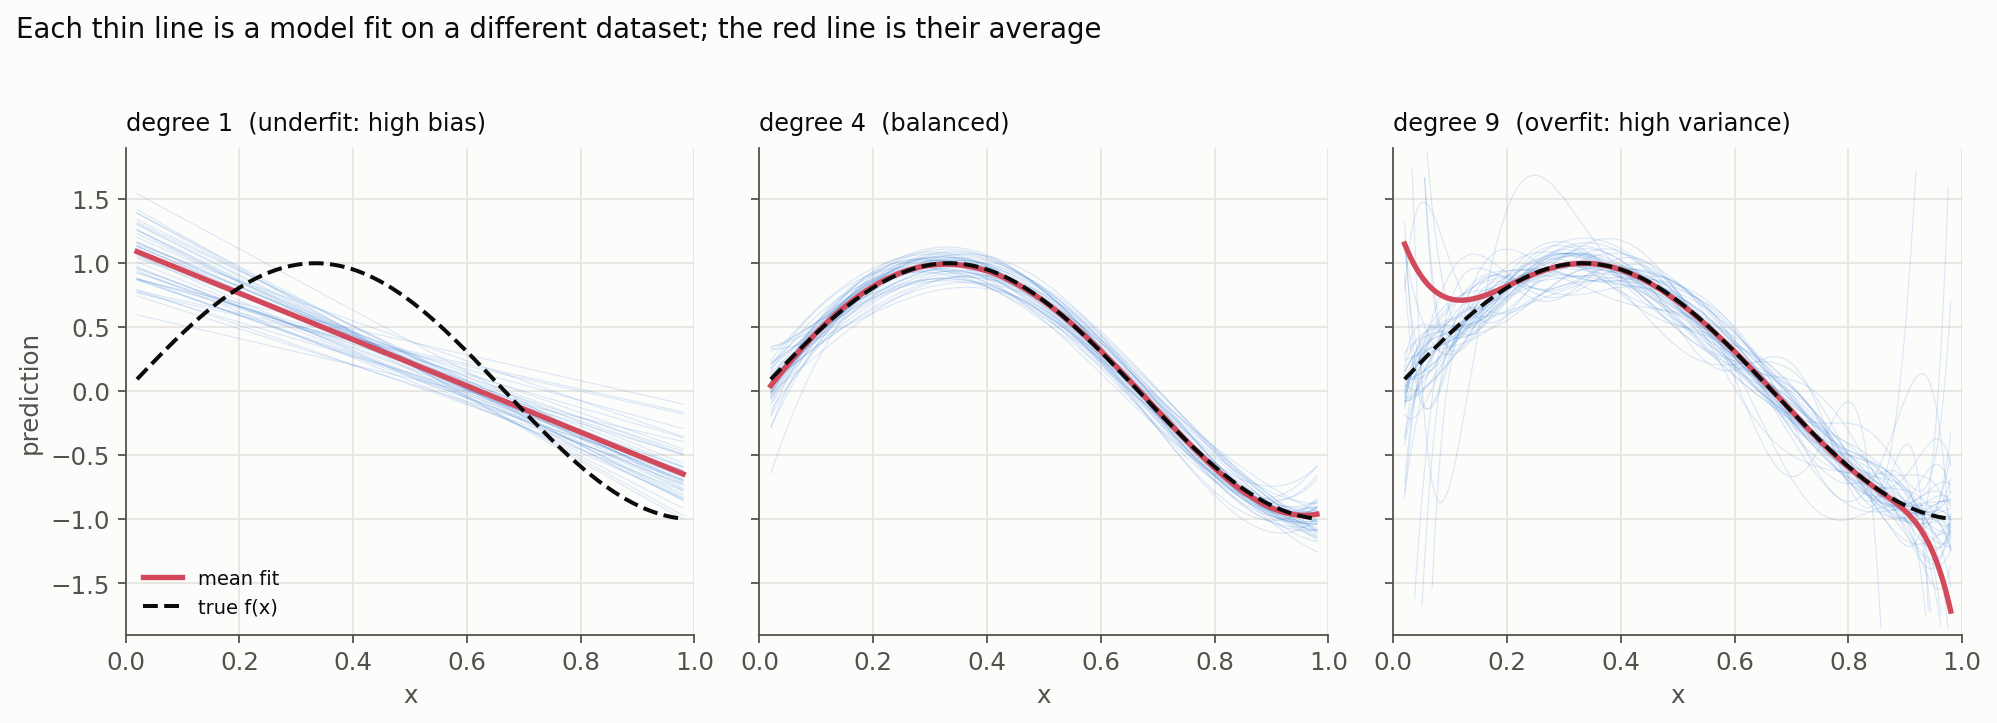
Read left to right, this is the tradeoff: the too-simple model is consistently wrong in the same way (biased but stable), the too-flexible model is right on average but violently unstable (low bias, high variance), and the middle model balances the two.
The Tradeoff in Machine Learning
In machine learning, the “bullseye” is the true underlying pattern in the data that we want our model to learn.
Bias is the error from a model being too simple to capture the true pattern. A high-bias model makes overly simplistic assumptions and is systematically off. In practice this tends to surface as underfitting.
Variance is the error from a model being so flexible that it chases the random noise specific to one training set. A high-variance model is over-sensitive to the exact data it happened to see. In practice this tends to surface as overfitting.
A distinction worth making explicit: bias and variance are theoretical properties of a learning procedure, averaged over all the datasets it might be trained on, whereas underfitting and overfitting are empirical diagnoses we read off actual train and validation performance. They are tightly related, which is why we pair them so casually, but they are not identical, and the empirical symptoms have other possible causes (data leakage, distribution shift, label noise, a poorly chosen metric, or an optimizer that never converged). We return to telling these apart in the diagnostics section below. One more disambiguation: this is statistical bias, the gap between an average estimate and the truth, not the societal, sampling, or fairness sense of the word, which is a different and equally important topic.
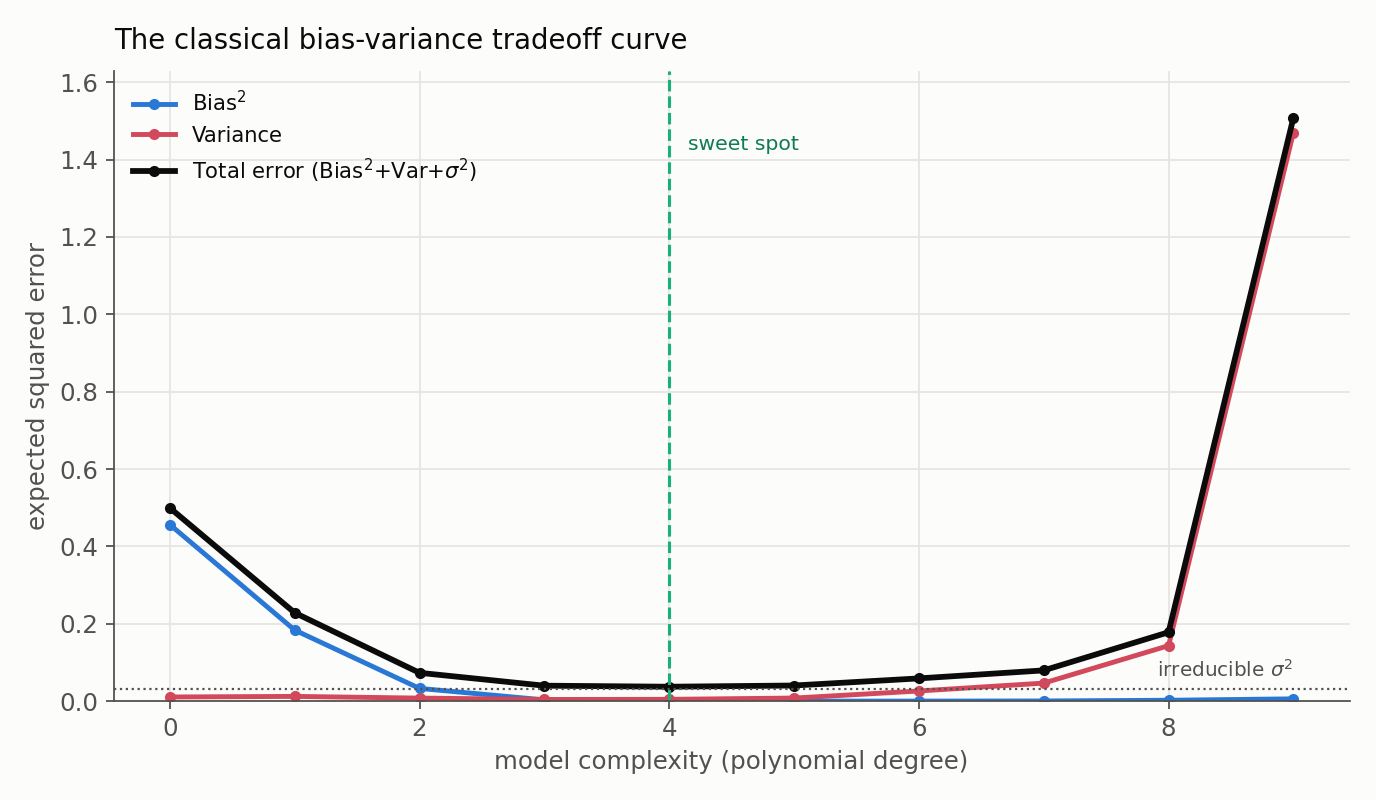
The Tradeoff: across a fixed model family, pushing complexity up often trades bias down for variance up, and vice versa, tracing the classic U-shaped total-error curve below. That word “often” is doing deliberate work. The U-curve is a useful teaching model, not an iron law: better data, better features, a better inductive bias, or regularization can lower both components at once, and heavily over-parameterized modern models can even exhibit double descent, where test error falls, rises, then falls again past the interpolation threshold, behavior the simple curve does not predict. Treat the U-curve as the right default intuition, not a universal guarantee.
Under squared-error regression (the setting we derive below), the decomposition is an exact equality, not an approximation:
Total Error = Bias² + Variance + Irreducible Error
- Irreducible Error: the variance of the outcome noise at that input, often written $\sigma^2$ (or, more honestly, $\sigma^2(x)$, since the noise level can differ across inputs). No model can eliminate it - though “irreducible” is relative to the features we have: better measurements or features can sometimes shrink what looked irreducible.
- Our job is to find the model complexity that minimizes the sum of Bias² and Variance.
A Practical Example: Predicting House Prices
Let’s say we want to build a model to predict the price of a house based on its features (size, number of bedrooms, location, age, etc.).
The High Bias (Underfitting) Model
- What we do: We create a very simple model. We decide to use only one feature: the size of the house (in square feet). Our model is a simple linear regression:
Price = θ₀ + θ₁ * Size - What the model learns: It learns a simple rule: “The bigger the house, the more expensive it is.”
- The Result (High Bias): This model is too simple. It completely ignores critical information like location (a small apartment in South Mumbai is more expensive than a large house in a rural area) or the age of the house. It will be systematically wrong for many houses. It fails to capture the true, complex relationship in the data. This is underfitting. Its variance will be low because if we train it on different sets of housing data, it will likely learn the same simple, upward-sloping line every time.
The High Variance (Overfitting) Model
- What we do: We get carried away and create an extremely complex model. We use a high-degree polynomial regression that considers every feature and all possible interactions between them.
Price = θ₀ + θ₁*Size + θ₂*Size² + ... + θ₁₀*Size¹⁰ + θ₁₁*Bedrooms + ... - What the model learns: This model is extremely flexible. It learns the main trends, but it can also start fitting the noise in our specific training data - learning, say, that a 3-bedroom house of exactly 1,753 sq ft is unusually expensive because one such house in our sample happened to be an outlier. With enough capacity relative to the amount of data, it can come close to memorizing the training set.
- The Result (High Variance): Such a model can have near-zero error on the data it was trained on yet do much worse on new, unseen houses, because it has locked onto the random noise rather than the general pattern. Retrained on a different sample of houses, it would learn noticeably different rules - exactly the wide-spread behavior we saw in the right panel of the figure above. This is overfitting. (Whether a given flexible model actually overfits depends on how much data we have and how we constrain it; high flexibility is a risk factor, not a guarantee.)
The “Goldilocks” (Good Balance) Model
- What we do: We aim for the sweet spot. We use a model that is complex enough to capture the important relationships but not so complex that it memorizes noise.
Model:A multiple linear regression with carefully selected features (Size,Bedrooms,Location_Score,Age) and perhaps some regularization (like Ridge or Lasso) to control the complexity. - What the model learns: It learns that price generally increases with size and number of bedrooms, decreases with age, and is heavily dependent on location.
- The Result (Good Balance): This model makes some small errors on the training data (it has a little bias), but it successfully captures the main trends. When shown new data, it makes sensible and reliable predictions. It generalizes well because it has managed the tradeoff between being too simple and too complex.
Diagnosing and Managing It in Practice
The theoretical bias and variance terms are not something a single train/test split hands us directly: that split gives one noisy estimate of test error, not the average-over-datasets quantities in the decomposition. Learning curves (error versus training-set size) and repeated cross-validation are far better lenses. Still, we can read the likely regime off the pattern of training and validation error and act on it:
| Observed pattern | Plausible diagnosis | Useful next checks / actions |
|---|---|---|
| Training and validation error both high | Too little capacity, too much regularization, or an optimization failure | Add useful features, reduce regularization, train longer / fix optimization, inspect residuals |
| Training error low, validation error much higher | High variance, or leakage / a train-test mismatch | Cross-validate, simplify or regularize, gather more data, audit for leakage |
| Both errors still falling as data grows | Data-limited regime | Collect more representative data |
| Validation error plateaus well above training error | Variance or distribution mismatch | Regularize, revisit the validation design, inspect per-segment errors |
Two cautions this table encodes. First, the same symptom can have non-capacity causes (leakage and distribution shift are the usual impostors), so confirm the cause before reaching for “more” or “less” complexity. Second, adding data reliably helps variance but does little for bias: a model that is too simple stays wrong no matter how many examples it sees.
The Math: Decomposing Mean Squared Error
This is a classic and elegant result in statistical learning theory: for squared-error regression, the expected prediction error at a single input $x$ splits cleanly into three parts - Bias, Variance, and an irreducible noise term. (This exact three-way split is specific to squared-error loss; classification and other losses do not decompose into these same three terms.)
Let’s walk through the expansion of $E[(y - \hat{f}(x))^2]$ step by step.
1. Setup and Assumptions
First, our terms and assumptions:
The True Relationship: the true value $y$ is generated by a fixed but unknown function $f(x)$ plus random noise $\epsilon$.
\[y = f(x) + \epsilon\]The Model: our model, trained on a specific dataset $D$, produces a prediction $\hat{f}(x)$. Trained on a different dataset it would predict differently, so $\hat{f}(x)$ is a random variable driven by the randomness in $D$.
Assumptions about the Noise ($\epsilon$):
- zero mean: $E[\epsilon] = 0$;
- independent of the training data and the model’s prediction;
- variance $\sigma^2$: $Var(\epsilon) = E[\epsilon^2] - (E[\epsilon])^2 = E[\epsilon^2] = \sigma^2$. (We take $\sigma^2$ constant for simplicity; in general it can be $\sigma^2(x)$, and nothing below breaks if it varies with $x$.)
Two independent sources of randomness feed the expectation, and keeping them straight is exactly what makes the cross-terms vanish cleanly later:
- the training set $D$ we happened to draw (this is what makes $\hat{f}(x)$ random);
- the fresh noise $\epsilon$ in the new outcome $y = f(x) + \epsilon$ we are trying to predict.
So $E[\cdot]$ below means $E_{D,\epsilon}[\cdot]$, an average over both. Our goal is to decompose this expected squared error at the point $x$:
\[MSE(x) = E_{D,\epsilon}[(y - \hat{f}(x))^2]\]The overall test error is then the average of $MSE(x)$ over the distribution of inputs $x$ we expect to see in deployment.
2. The Derivation
Here is the step-by-step expansion.
Step 1: Substitute the true relationship for $y$.
We start by replacing $y$ with its definition, $f(x) + \epsilon$.
\[MSE = E[(f(x) + \epsilon - \hat{f}(x))^2]\]Step 2: Rearrange terms and expand the square.
Let’s group the model-related terms together. We’ll treat (f(x) - f̂(x)) as one part (A) and ε as the other part (B) and expand the square $(A+B)^2 = A^2 + 2AB + B^2$.
Step 3: Apply the Linearity of Expectation.
The expectation of a sum is the sum of the expectations.
\[MSE = E[(f(x) - \hat{f}(x))^2] + E[2\epsilon(f(x) - \hat{f}(x))] + E[\epsilon^2]\]Step 4: Simplify each term.
The last term, $E[\epsilon^2]$: From our assumptions, we know the variance of the noise is $\sigma^2 = E[\epsilon^2]$. This term is the Irreducible Error. It’s the noise inherent in the data that no model can ever eliminate.
The middle term, $E[2\epsilon(f(x) - \hat{f}(x))]$: We can pull out the constant 2. Because we assumed $\epsilon$ is independent of our data and model, we can separate the expectations:
\[2E[\epsilon(f(x) - \hat{f}(x))] = 2E[\epsilon] \cdot E[f(x) - \hat{f}(x)]\]Since we assumed the mean of the noise is zero ($E[\epsilon] = 0$), this entire middle term becomes zero.
\[2 \cdot (0) \cdot E[f(x) - \hat{f}(x)] = 0\]The first term, $E[(f(x) - \hat{f}(x))^2]$: This is the Expected Squared Error between the true function and our model’s prediction. We need to expand this part further.
Our equation now looks like this:
\[MSE = E[(f(x) - \hat{f}(x))^2] + \sigma^2\]Step 5: Decompose the remaining error term.
This is the clever part of the proof. We add and subtract the same quantity, $E[\hat{f}(x)]$, inside the square. $E[\hat{f}(x)]$ represents the average prediction our model would make at point $x$ if we were to train it on many different datasets.
\[E[(f(x) - \hat{f}(x))^2] = E[(f(x) - E[\hat{f}(x)] + E[\hat{f}(x)] - \hat{f}(x))^2]\]Now, group the terms again. Let $A = (f(x) - E[\hat{f}(x)])$ and $B = (E[\hat{f}(x)] - \hat{f}(x))$ and expand $(A+B)^2$:
\[= E[ \underbrace{(f(x) - E[\hat{f}(x)])^2}_{A^2} + \underbrace{2(f(x) - E[\hat{f}(x)])(E[\hat{f}(x)] - \hat{f}(x))}_{2AB} + \underbrace{(E[\hat{f}(x)] - \hat{f}(x))^2}_{B^2} ]\]Apply linearity of expectation one more time:
\[= E[(f(x) - E[\hat{f}(x)])^2] + E[2(f(x) - E[\hat{f}(x)])(E[\hat{f}(x)] - \hat{f}(x))] + E[(E[\hat{f}(x)] - \hat{f}(x))^2]\]Let’s analyze these three new terms:
First term: $E[(f(x) - E[\hat{f}(x)])^2]$ The quantities $f(x)$ and $E[\hat{f}(x)]$ are constants with respect to the expectation, so the expectation has no effect. The term is $(f(x) - E[\hat{f}(x)])^2$. This is the squared difference between the true function’s value and the average prediction of our model. This is the definition of Squared Bias.
\[\text{Bias}^2 = (f(x) - E[\hat{f}(x)])^2\]Third term: $E[(E[\hat{f}(x)] - \hat{f}(x))^2]$ This is the expected squared difference between the average model prediction and a specific model’s prediction. This is the definition of Variance. It measures how much our model’s predictions would scatter if we trained it on different datasets.
\[\text{Variance} = E[(\hat{f}(x) - E[\hat{f}(x)])^2]\]Middle term: $E[2(f(x) - E[\hat{f}(x)])(E[\hat{f}(x)] - \hat{f}(x))]$
The part $(f(x) - E[\hat{f}(x)])$ is a constant, so we can pull it out of the expectation:
\[2(f(x) - E[\hat{f}(x)]) \cdot E[E[\hat{f}(x)] - \hat{f}(x)]\]The expectation of a difference is the difference of expectations:
\[E[E[\hat{f}(x)] - \hat{f}(x)] = E[E[\hat{f}(x)]] - E[\hat{f}(x)]\]The expectation of a constant ($E[\hat{f}(x)]$ is a constant) is just the constant itself, so $E[E[\hat{f}(x)]] = E[\hat{f}(x)]$.
\[= E[\hat{f}(x)] - E[\hat{f}(x)] = 0\]Therefore, the entire middle term is zero.
Step 6: Final Assembly
Putting it all back together, the decomposition of $E[(f(x) - \hat{f}(x))^2]$ is:
\[E[(f(x) - \hat{f}(x))^2] = \text{Bias}^2 + \text{Variance}\]Now, substitute this into our equation from the end of Step 4:
\[MSE = \underbrace{\text{Bias}^2 + \text{Variance}}_{\text{from Step 5}} + \underbrace{\sigma^2}_{\text{from Step 4}}\]This gives us the final, famous decomposition:
\[E[(y - \hat{f}(x))^2] = \text{Bias}(\hat{f}(x))^2 + \text{Variance}(\hat{f}(x)) + \text{Irreducible Error}\]And that is the whole story in one line, and the three terms are not abstract. Bias² is the gap between the dashed truth and the red average-fit in the repeated-fits figure; Variance is the spread of the thin blue curves around that average; and the Irreducible Error is the noise floor the U-curve bottoms out on. Minimizing test error means trading the first two against each other while accepting the third - and, as the diagnostics stressed, first making sure the symptom we are treating really is bias or variance, and not an impostor like leakage or distribution shift.