A Short Primer on KL/JS Divergence
KL and Jensen-Shannon divergence for drift monitoring: what they measure, why direction and support matter, the divergence-vs-distance and log-base gotchas, and how to turn a drift score into a decision (not an automatic retrain).
KL and JS Divergence for Drift Detection
In the high-stakes world of machine learning production systems, especially in domains like Fraud Detection, deploying a model is only the beginning. The real challenge begins on Day 2: dealing with the ever-changing nature of the real world.
Models are trained on historical data, but they operate on live data. When these two distributions diverge, a model’s performance can degrade - though, as we will keep stressing, a distribution shift is a signal to investigate, not proof that quality dropped or that retraining is due. This phenomenon of shifting inputs is broadly called Data Drift.
To catch it, MLOps engineers reach for statistical distance measures. The most famous is Kullback-Leibler (KL) Divergence, and a popular, better-behaved companion is Jensen-Shannon (JS) Divergence. This post covers both: what they actually measure, the sharp edges that bite in production, and why JS is often (not always) the safer default for automated alerting. Neither is “the one right metric” - Wasserstein distance, the Kolmogorov-Smirnov statistic, and direct task metrics all have a place too.
One convention before we start, because it governs every number below: we use natural logarithms (nats) throughout. With natural logs, JS divergence is bounded by $\ln 2 \approx 0.693$; with base-2 logs it is bounded by 1. Always record which base (and, as we will see, whether a stored value is a divergence or its square-root distance) in the monitoring metadata.
1. The Tale of Two Metrics: KL vs. JS Divergence
Both metrics answer the same fundamental question: “How different is my live production data (Q) from my original training data (P)?”
Kullback-Leibler (KL) Divergence
Often called “relative entropy,” KL measures an information cost: how many extra nats we pay, on average, when we encode outcomes drawn from $P$ using a code built for $Q$.
\[KL(P \Vert Q) = \sum_{i} P(i) \cdot \ln\left(\frac{P(i)}{Q(i)}\right)\]Two properties matter enormously in production, and neither is a mere inconvenience:
- It is asymmetric: $KL(P \Vert Q) \neq KL(Q \Vert P)$. This is not just “confusing” - the direction means something. The sum is an expectation under $P$, so it weights each bin by how often $P$ visits it, and it assigns an infinite penalty to any bin where $P(i) > 0$ but $Q(i) = 0$ (a region $P$ cares about that $Q$ gives no mass). Swapping the arguments swaps which kind of support-mismatch blows up, so we must choose the reference-vs-live direction deliberately and state it. Throughout this post, $P$ is the training reference and $Q$ is the live traffic.
- It is unbounded: it ranges over $[0, \infty)$, which is exactly the sharp edge we hit in Section 3.
Jensen-Shannon (JS) Divergence
JS Divergence is the “smoothed, symmetric cousin” of KL Divergence. It fixes the stability issues of KL by comparing both distributions to their average mixture ($M$).
It is a two-step calculation:
Step 1: Create the Average Distribution (M) First, we define an average distribution, $M$, which is the midpoint between $P$ and $Q$:
\[M = \frac{1}{2}(P + Q)\]- For each event $i$, this is just $M(i) = \frac{P(i) + Q(i)}{2}$.
Step 2: Calculate the JS Divergence The JS Divergence is the average of the KL Divergences from $P$ to $M$ and from $Q$ to $M$:
\[JSD(P || Q) = \frac{1}{2}KL(P || M) + \frac{1}{2}KL(Q || M)\]This seemingly small change gives it three big advantages:
- Symmetry: $JSD(P \Vert Q) = JSD(Q \Vert P)$, so there is no direction to choose. (A precise note, because this is widely misstated: JS divergence is not itself a distance metric - it does not satisfy the triangle inequality. Its square root, $\sqrt{JSD}$, is a proper metric, the Jensen-Shannon distance.)
- Bounded score: with natural logs the result is always in $[0, \ln 2] \approx [0, 0.693]$, which makes threshold-setting far less arbitrary than with an open-ended KL.
- Graceful with zeros: because each side is compared to the mixture $M$ (which is zero only where both $P$ and $Q$ are zero), it never divides by zero the way KL does. More on this below.
A gotcha worth burning into memory. SciPy’s
scipy.spatial.distance.jensenshannon(p, q)returns the distance ($\sqrt{JSD}$), not the divergence. A value read from SciPy is already square-rooted. If half a dashboard stores the divergence and the other half stores SciPy’s distance, the thresholds will silently disagree. Pick one and label it.
2. Real-World Use Case: The Fraud Detection System
Let’s visualize a standard fraud detection pipeline to see where these metrics fit in.
Imagine a PayPal-like transaction system processing millions of payments.
- The “Golden Profile” ($P$): Before deploying Fraud_Model_v1, we calculated the statistical distribution of key features (like transaction_amount) in the training set.
- The Live Monitor ($Q$): Every hour, a Flink or Spark job calculates the distribution of the exact same features from the last hour of live traffic.
The monitor runs a simple test: IF Distance(P, Q) > Threshold THEN Alert.
If the distance spikes, something about the incoming data has changed. That is a cue to investigate, not a verdict, and we will come back to what to do with an alert (and to why a fixed “Threshold” is trickier than it looks).
Three kinds of “change” are worth keeping separate, because people lump them together and then mis-diagnose:
- Covariate drift - the input distribution $P(X)$ moves (the feature examples below).
- Label / prior shift - the class balance $P(Y)$ moves (fraud going from 1% to 3%).
- Concept drift - the relationship $P(Y \mid X)$ moves: the same inputs now imply a different answer. This is the hardest to detect and, strictly, the only one the phrase “concept drift” should name.
A divergence computed on a feature or on the label distribution measures the first two directly; it can only ever be a proxy for the third.
Example 1: Detecting Data Drift (P(X) changes)
Data drift is a change in the input features. We monitor each feature independently.
- Feature:
transaction_amount(Continuous)- Step 1: Create
P_trainProfile.- We can’t use raw numbers. So, we bin (discretize) the feature into a histogram.
- Training Data Profile (
P):$0 - $50: 40%$50 - $100: 30%$100 - $500: 20%$500+: 10%
- Step 2: Create
P_liveProfile.- We run the same binning on the last 24 hours of live traffic.
- Live Data Profile (
Q):$0 - $50: 20% (A big drop!)$50 - $100: 25%$100 - $500: 30%$500+: 25% (A big increase!)
- Step 3: Calculate
KL(P || Q)- The
KLformula sums the per-bin contributions; the big “surprises” are the$0-$50bin (40% down to 20%) and the$500+bin (10% up to 25%). - Working it out gives $KL(P \Vert Q) \approx 0.159$ nats. (That is one number for one choice of bins - a caveat we return to below.)
- The
- Step 4: Investigate, then decide.
- The score clears our warning band, so the alert fires. But “alert” means look, not retrain.
- A plausible story: fraudsters have stopped making small test transactions and are now attempting large thefts, so the inputs have drifted. If investigation confirms a genuine, persistent shift - and rules out a logging bug or a one-off promotion - retraining on the “new normal” may well be right. That conclusion comes after the checks in the playbook below, not automatically from the score.
- Step 1: Create
- Feature:
merchant_category(Categorical) This is even easier. The bins are just the categories.P_train:{"groceries": 0.5, "electronics": 0.2, "gambling": 0.05, ...}P_live:{"groceries": 0.4, "electronics": 0.2, "gambling": 0.15, ...}- Action: The
KLscore for this feature will be high because the “gambling” probability has tripled. This is a clear data drift signal.
Example 2: Detecting Label / Prior Shift (P(y) changes)
A common confusion first: watching the target distribution P(y) is often called concept-drift detection, but a shift in P(y) alone is label (prior) shift, not concept drift. Concept drift is a change in the relationship P(y|X), which P(y) cannot reveal on its own. (A score-distribution proxy P(score) is likewise an indirect hint about changed inputs or model behavior, not proof that P(y|X) moved.) With the label corrected, tracking P(y) is still genuinely useful - here is what it does and doesn’t tell us.
Method: Target Distribution (P(y))
- Step 1: Create
P_trainProfile. This needs our labeled training data.- Training Data Profile (
P):y=0: 99%,y=1 (Fraud): 1%.
- Training Data Profile (
- Step 2: Create
P_liveProfile. This needs a feedback loop - the (delayed) ground-truth labels for recent traffic.- Live Data Profile (
Q):y=0: 97%,y=1 (Fraud): 3%.
- Live Data Profile (
Step 3: Calculate
KL(P || Q). The fraud class is 3x more likely than in training, a big relative change. But watch the actual number: $KL(P \Vert Q) \approx 0.009$ nats, which is tiny. That is a lesson in itself: divergence magnitude is not operational severity. Because both distributions are dominated by the 99% “not fraud” bin, the divergence stays small even though the business-critical minority class tripled. A raw drift score would barely blink while the thing we actually care about moved a lot.- Step 4: Investigate, then decide. A tripling of the fraud base rate genuinely matters: a model tuned for 1-in-100 fraud will likely under-flag at 3-in-100, and its probability calibration is now off. But the response still depends on confirming the labels are trustworthy (feedback loops are noisy and delayed), checking whether it is a transient spike or a lasting shift, and measuring actual downstream performance. The fix might be retraining - or it might be recalibration or a threshold change, a cheaper and faster remedy for a pure prior shift. The score starts the investigation; it does not end it.
3. The “Corner Case” That Breaks KL Divergence
This is where the theory hits reality. In fraud detection, data is messy. New trends appear instantly, and old trends vanish.
Let’s look at a categorical feature: merchant_category.
The Scenario: “The Crypto Attack”
Suppose our model was trained in 2020. Back then, nobody bought Crypto on our platform.
- Training Data ($P$): {“groceries”: 0.5, “travel”: 0.5, “crypto”: 0.0}
In 2025, a new fraud attack targets Crypto transactions. Suddenly, our live traffic looks like this:
- Live Data ($Q$): {“groceries”: 0.5, “travel”: 0.0, “crypto”: 0.5}
Notice two things happened:
- A new category appeared (crypto went from 0.0 to 0.5).
- An old category disappeared (travel went from 0.5 to 0.0).
How KL Divergence Fails
If we try to calculate the drift score using KL, we hit a mathematical wall.
- Case A:
P(i) > 0butQ(i) = 0(the “travel” bin)- $P(\text{travel}) = 0.5$, but $Q(\text{travel}) = 0.0$.
- Its term is $P \cdot \ln(P/Q) = 0.5 \cdot \ln(0.5 / 0) = 0.5 \cdot \ln(\infty) = +\infty$.
- Result: infinite drift. The whole score becomes $\infty$, and the dashboard shows
inforNaN.
- Case B:
P(i) = 0butQ(i) > 0(the “crypto” bin)- $P(\text{crypto}) = 0.0$, but $Q(\text{crypto}) = 0.5$.
- By the standard convention $0 \cdot \ln(0 / 0.5) = 0$, so this bin contributes nothing.
- Result: the drift is silently missed. KL in this direction is blind to a brand-new category, because it only averages over bins that $P$ actually visits.
The first case is the loud failure: the metric “blows up.” An infinity is useless for monitoring - it says something broke but nothing about magnitude, and today’s infinity is indistinguishable from yesterday’s. The second case is the quiet failure, and arguably the worse one: a genuinely important new behavior (the crypto attack) contributes exactly zero to the score.
The usual patch - smoothing - and its fine print. To stop $Q(i) = 0$ from forcing an infinity, teams smooth: add a small pseudocount or epsilon to every bin so nothing is exactly zero, then renormalize. This is a deliberate modeling choice we make, not something the math or the library quietly does for us. (scipy.stats.entropy and scipy.spatial.distance.jensenshannon do not add epsilon on our behalf; hand them a zero-support mismatch and KL comes back inf.) Because smoothing changes the estimated distributions and therefore the score, it has to be documented: the epsilon/pseudocount value, the unseen-category policy, the renormalization, and how sensitive the alerts are to that choice.
How JS Divergence Saves the Day
Now run the same “Crypto Attack” scenario through JS Divergence.
- Calculate the mixture ($M$):
- $M(\text{groceries}) = 0.5$, $M(\text{travel}) = (0.5 + 0)/2 = 0.25$, $M(\text{crypto}) = (0 + 0.5)/2 = 0.25$.
- Notice: the zeros are gone - $M$ has mass wherever either $P$ or $Q$ does.
- Calculate the score:
Comparing each side to $M$ never divides by zero, and here both halves work out to $\frac{1}{2}\ln 2$:
\[JSD(P \Vert Q) = \tfrac{1}{2}KL(P \Vert M) + \tfrac{1}{2}KL(Q \Vert M) = \tfrac{1}{2}\ln 2 \approx 0.3466 \text{ nats.}\]
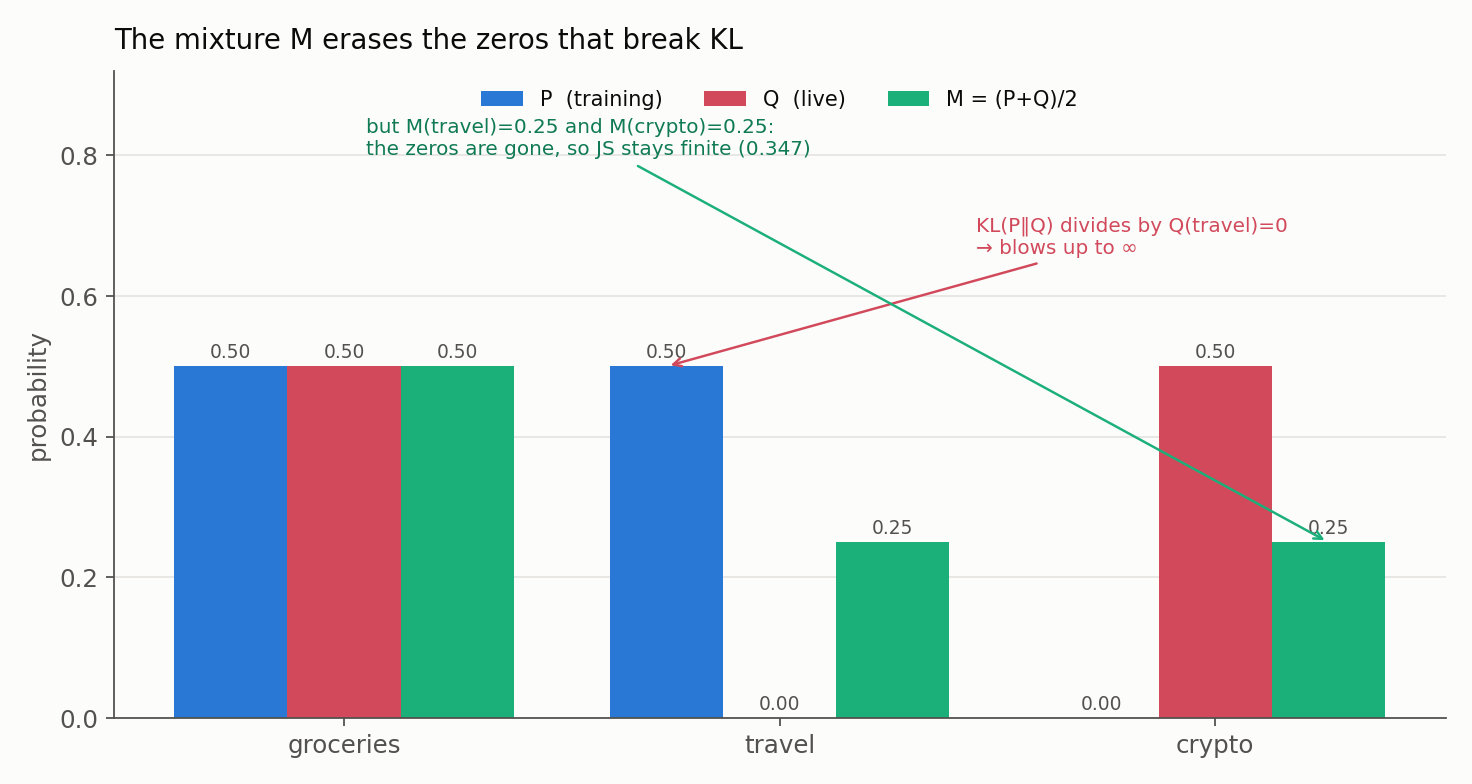
The figure shows why it works: the mixture $M$ (green) fills in exactly the zero bins that made KL divide by zero.
Reading the number honestly. JS returns a precise, finite 0.3466 nats, which is half of the natural-log maximum ($\ln 2 \approx 0.693$). That is a large relative movement - but “50% of max” is not itself a verdict. Divergence is not a p-value and carries no universal severity scale; whether 0.35 warrants paging someone depends entirely on what a normal day looks like for this feature (see threshold calibration below).
In code, name the two quantities explicitly so nobody confuses the distance with the divergence:
1
2
3
4
5
6
7
8
import numpy as np
from scipy.spatial import distance

p = [0.5, 0.5, 0.0]   # groceries, travel, crypto  (training)
q = [0.5, 0.0, 0.5]   # groceries, travel, crypto  (live)

js_distance   = distance.jensenshannon(p, q, base=np.e)  # ~0.589  (SciPy returns THIS)
js_divergence = js_distance ** 2                         # ~0.347  (= 1/2 * ln 2)
4. Turning a Drift Score into a Decision
The math is the easy part. The gap between “we computed a divergence” and “we monitor drift well” is where most production pain lives. Four things deserve as much care as the metric itself.
1. The binning is part of the metric. For a continuous feature, the divergence is not a property of the data alone - it depends on the histogram we impose: the bin boundaries, the reference window, the sample size, and how we treat missing values and outliers. Recompute the bins every day and the score wanders for reasons that have nothing to do with drift. The fix is to fix the reference bins from training and reuse them, and to include explicit missing, overflow, and unseen-category buckets so new behavior lands somewhere instead of silently vanishing (Case B) or exploding (Case A).
2. Bounded vs unbounded is the real reason to prefer JS for alerts. The crypto headache is one instance of a general fact: as two distributions pull apart, KL runs off toward infinity while JS glides up to its $\ln 2$ ceiling. The plot makes it vivid for two Gaussians sliding apart - KL is a runaway parabola, JS a gentle plateau:
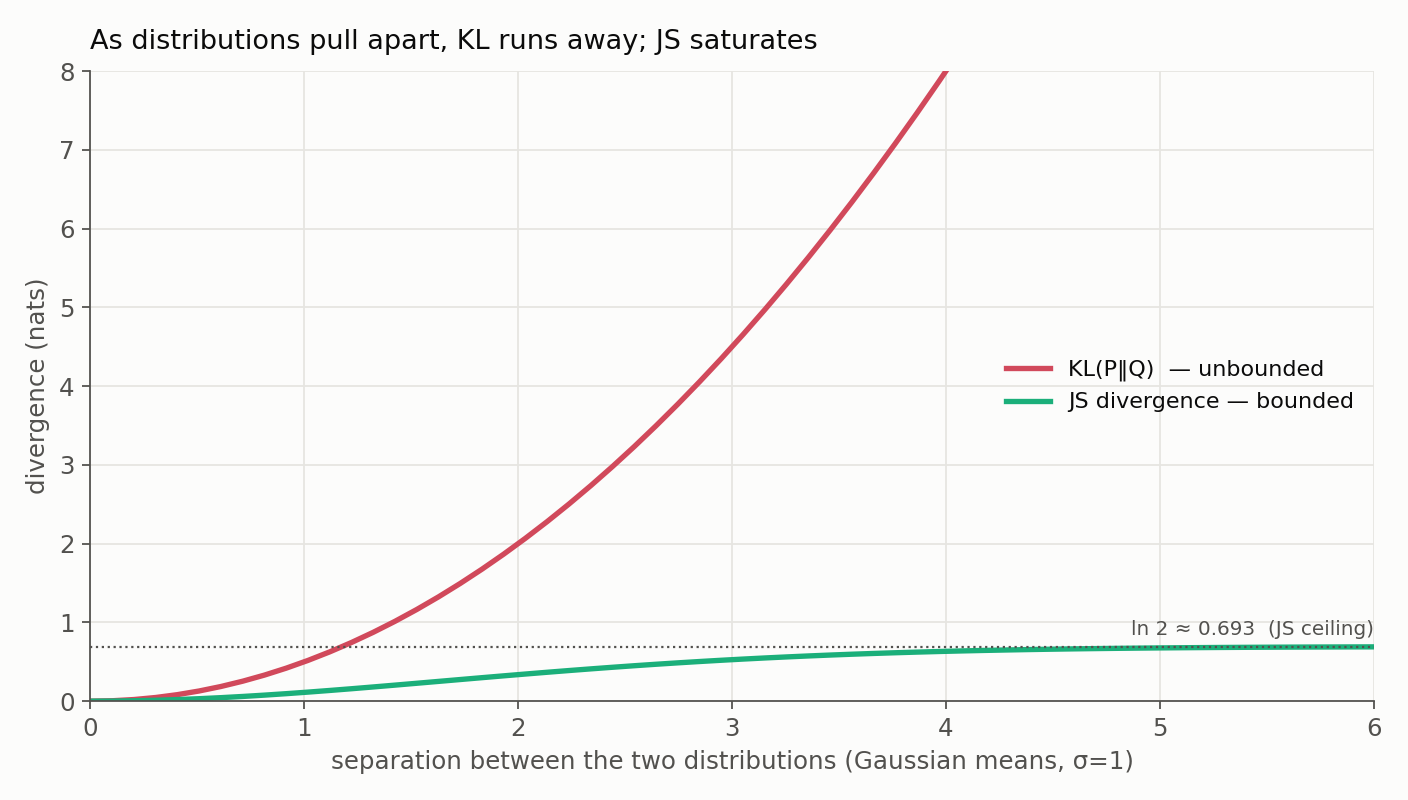
A bounded, always-finite score is simply easier to threshold, log, and trend than one that can come back inf.
3. There is no universal threshold. “Alert if JS > 0.1” is a number with no inherent meaning. Calibrate alert bands from this feature’s own history: the spread across stable windows, expected seasonality (weekends look different from weekdays), and bootstrap or permutation variability so we know how much the score jitters from sampling alone. Prefer a warning band and a critical band, plus a persistence requirement (drift that lasts several windows), over a single instantaneous cutoff, and weigh the cost of a false page against a missed shift.
4. One feature at a time is not enough. Per-feature divergences can all look calm while the joint distribution has shifted (two features that used to move together no longer do). Effective monitoring is layered: (1) schema and data-quality checks, (2) univariate feature drift, (3) a multivariate check such as a domain classifier trained to tell “training” from “live,” (4) drift in the model’s own predictions and uncertainty, and (5) the slowest but most decisive signal - delayed labeled performance, calibration, and business metrics. No single divergence deserves to be called “the production standard.”
And when an alert fires, follow the evidence, not a reflex: validate the pipeline (schema, logging, a population change, a botched deploy); quantify how much of the move is just sampling noise; localize the affected features, segments, and time windows; check delayed labeled performance and calibration; weigh the business impact; and only then choose to retrain, recalibrate, adjust rules, or do nothing. Retraining on corrupt or transient data is a great way to make a healthy system worse.
Summary
| Property | KL Divergence | JS Divergence |
|---|---|---|
| Symmetric? | No; direction $P \Vert Q$ vs $Q \Vert P$ carries meaning | Yes |
| Disjoint support | Infinite (Case A) or silently ignored (Case B) | Finite; the mixture $M$ handles it |
| Range (natural log) | $[0, \infty)$ | $[0, \ln 2] \approx [0, 0.693]$ |
| A true distance metric? | No | The divergence no; its square root $\sqrt{JSD}$ yes |
| Default for automated alerts | Needs explicit smoothing; can be inf | Bounded and finite, easier to threshold |
For a fraud-detection system where new categories appear overnight, JS is usually the safer default for automated alerting, precisely because it stays bounded and finite. That is not the same as KL being “wrong”: KL is the more fundamental quantity - it is what cross-entropy and maximum-likelihood training optimize, and what mutual information is built from - and it is the right tool when we specifically want the asymmetric, encode-$P$-with-$Q$ interpretation. Choose the metric for the job, log the base and the divergence-vs-distance convention, and treat the score as an early-warning signal, not an automatic retraining trigger.
Where this connects. Here KL compared two aggregate distributions to monitor a live system. In the next article, the very same quantity shows up point by point: cross-entropy training asks a model’s predicted distribution $Q(\cdot \mid x)$ to approximate the true label distribution $P(\cdot \mid x)$ for every example, and minimizing cross-entropy turns out to be minimizing exactly this KL.
Resources
- Gama, J., Žliobaitė, I., Bifet, A., Pechenizkiy, M. & Bouchachia, A. (2014). A Survey on Concept Drift Adaptation. ACM Computing Surveys, 46(4).
- SciPy:
scipy.spatial.distance.jensenshannon- returns the JS distance ($\sqrt{JSD}$), not the divergence.