Understanding PCA Once and for All
Principal Component Analysis (PCA) is fundamentally a geometric optimization problem: finding the directions that capture the maximum variance in a dataset. This article derives the core equations from the ground up, so that why we rely on eigenvectors and eigenvalues is never a black box. We assume the data is real-valued and numeric, and we care about a linear, unsupervised change of basis. Everything flows from one chain: projection leads to covariance, covariance to a variance-maximization problem, that problem to the eigenvalue equation, and the eigenvalue equation to a practical SVD recipe.
Notation. We hold to one set of symbols throughout:
| Symbol | Meaning |
|---|---|
| $m,\ n,\ k$ | samples, original features, retained components ($k \ll n$) |
| $\mathbf{X}$, $\mu$ | raw $m\times n$ data matrix; feature-mean row vector |
| $\mathbf{X}_c = \mathbf{X} - \mathbf{1}\mu^T$ | centered data matrix |
| $\mathbf{C} = \frac{1}{m-1}\mathbf{X}_c^T\mathbf{X}_c$ | sample covariance matrix ($n\times n$) |
| $\mathbf{X}_c^T\mathbf{X}_c = (m-1)\mathbf{C}$ | Gram / scatter matrix |
| $\mathbf{w},\ \mathbf{v}_j$ | a unit projection direction; the $j$-th eigenvector (principal axis) |
| $\lambda_j,\ \sigma_j$ | covariance eigenvalue (explained variance) and singular value, with $\lambda_j = \sigma_j^2/(m-1)$ |
| $\mathbf{z} = \mathbf{X}_c\mathbf{w}$, $\mathbf{Z} = \mathbf{X}_c\mathbf{V}_k$ | score vector / score matrix |
The Geometric Core: From Projection to Eigenvectors
PCA is a geometric optimization problem: finding the directions that capture the maximum variance in a dataset. This first half derives the core equations that explain why eigenvectors and eigenvalues solve dimensionality reduction.
1. The Geometric Foundation: Vector Projection
The first step in PCA is projecting data onto a new axis. We start by deriving the equation for projecting an arbitrary vector $\mathbf{x}$ onto an arbitrary vector $\mathbf{v}$.
The projection, $\mathbf{p}$, of vector $\mathbf{x}$ onto $\mathbf{v}$ is defined as the component of $\mathbf{x}$ that lies along the direction of $\mathbf{v}$.
Derivation of the Projection Vector $\mathbf{p}$
Find the scalar projection. The dot product $\mathbf{x} \cdot \mathbf{v}$ gives the component of $\mathbf{x}$ parallel to $\mathbf{v}$, scaled by the length of $\mathbf{v}$. Dividing by $\lVert\mathbf{v}\rVert$ gives the signed scalar projection (it is negative when $\mathbf{x}$ points against $\mathbf{v}$; the geometric length is its absolute value):
\[\operatorname{comp}_{\mathbf{v}}(\mathbf{x}) = \frac{\mathbf{x} \cdot \mathbf{v}}{\|\mathbf{v}\|}\]Find the Direction: The direction of $\mathbf{p}$ is the unit vector along $\mathbf{v}$, denoted $\mathbf{u}$.
\[\mathbf{u} = \frac{\mathbf{v}}{\|\mathbf{v}\|}\]Form the projection vector. The projection vector $\mathbf{p}$ is the signed scalar projection multiplied by the unit direction vector $\mathbf{u}$.
Substituting $\mathbf{u} = \frac{\mathbf{v}}{\|\mathbf{v}\|}$, the projection vector $\mathbf{p}$ can be written as:
\[\mathbf{p} = \frac{\mathbf{x} \cdot \mathbf{v}}{\|\mathbf{v}\|^2} \mathbf{v}\]2. The Statistical Foundation: Data Centering and Covariance
PCA is a procedure that maximizes variance, which is intimately related to the covariance matrix.
Defining Covariance and Centering
The population covariance between two random variables $X$ and $Y$ is the expected product of their deviations from their means:
\[\operatorname{Cov}(X, Y) = E[(X - E[X])(Y - E[Y])].\]Given $m$ paired samples, we estimate it with the unbiased sample covariance:
\[\widehat{\operatorname{Cov}}(X, Y) = \frac{1}{m-1}\sum_{i=1}^{m} (X_i - \bar{X})(Y_i - \bar{Y}).\]From here on we work with the sample covariance of a data matrix, writing $\bar{X}$ (or $\mu$ for the full mean vector) for the empirical feature mean and reserving $E[\cdot]$ for the population quantity.
A natural extension for covariance for an n-dimensional dataset of size m, would be a covariance matrix of dimension $n \times n$.
\[\operatorname{Cov}(\mathbf{X}) = \begin{bmatrix} \operatorname{Cov}(X_1, X_1) & \operatorname{Cov}(X_1, X_2) & \cdots & \operatorname{Cov}(X_1, X_n) \\ \operatorname{Cov}(X_2, X_1) & \operatorname{Cov}(X_2, X_2) & \cdots & \operatorname{Cov}(X_2, X_n) \\ \vdots & \vdots & \ddots & \vdots \\ \operatorname{Cov}(X_n, X_1) & \operatorname{Cov}(X_n, X_2) & \cdots & \operatorname{Cov}(X_n, X_n) \end{bmatrix}\]- Diagonal entries: variances
- Off-diagonal entries: covariances between each pair of dimensions
Before calculating the covariance matrix, data is typically centered. Centering data $\mathbf{x}$ involves subtracting the mean $\mu$ of the entire dataset $\mathbf{X}$ from every data point: $\mathbf{X}_{\text{centered}} = \mathbf{X} - E(\mathbf{X})$. Effectively, we’ll be subtracting the mean of each column for itself.
If the data is perfectly centered, the mean of the new dataset is zero: $E(\mathbf{X}_{\text{centered}}) = \mathbf{0}$.
Effect of Centering on the Covariance Matrix
Let $\mathbf{X}$ be the original $m \times n$ feature matrix (where $m$ is the number of samples and $n$ is the number of features). Let $\mathbf{X}_c$ be the centered matrix.
The Covariance Matrix of the dataset $\mathbf{X}$ is a square $n \times n$ matrix where the element at $(i, j)$ is the covariance between feature $i$ and feature $j$.
For centered data $\mathbf{X}_c$, we fix a single symbol for the sample covariance matrix and use it everywhere below:
\[\mathbf{C} = \frac{1}{m-1}\mathbf{X}_c^T\mathbf{X}_c.\]The unscaled product $\mathbf{X}_c^T\mathbf{X}_c$ is the Gram (scatter) matrix; it equals $(m-1)\mathbf{C}$. Keeping the two apart matters later: the eigenvalues of $\mathbf{C}$ are explained variances, while the eigenvalues of the Gram matrix are $(m-1)$ times larger. The scaling factor does not change which direction maximizes variance, so the optimization can use either matrix - but the eigenvalue it reports means different things.
Centering versus Standardization
Centering is required: PCA is defined on deviations from the mean, and without it the leading component often just points at the data’s offset from the origin. Standardizing each feature to unit variance is a separate modeling decision, and it changes the question being asked:
- Center-only PCA works on the covariance matrix $\mathbf{C}$. Features with larger numeric variance pull the components toward themselves, so a single feature measured in grams can dominate one measured in kilograms purely because its numbers are bigger.
- Standardized PCA is equivalent to PCA on the correlation matrix. It puts features on comparable scales, usually the right choice when units are mixed (centimeters and kilograms in one matrix).
Neither is universally correct. If feature magnitudes carry meaningful physical scale, forcing unit variance can throw away real signal; if they are arbitrary units, standardizing avoids a scale artifact. The one hard rule is that the scaler, like the mean, must be fit on training data only.
3. The Optimization Problem: Maximizing Projected Variance
Let $\mathbf{X}$ be the centered training data matrix ($m$ rows/samples, $n$ columns/features). Let $\mathbf{w}$ be the principal component vector (our projection axis), which is an $n \times 1$ vector.
Data Projection
For a unit vector $\mathbf{w}$, the score of the $i$-th centered row $\mathbf{x}_i$ is exactly the signed scalar coordinate $z_i = \mathbf{x}_i^T\mathbf{w}$ (its sign flips if $\mathbf{w}$ is negated). The corresponding vector projection back in feature space is $z_i\,\mathbf{w} = (\mathbf{w}\mathbf{w}^T)\mathbf{x}_i$. PCA optimizes over the scalar scores $z_i$; the vector form only matters for reconstruction.
Stacking the scores for every row gives a single matrix product:
\[\mathbf{z} = \mathbf{X}_c\mathbf{w} \quad (\text{an } m \times 1 \text{ vector of scores}).\]Maximizing Variance
PCA finds the unit vector $\mathbf{w}$ that maximizes the variance of these scores. Because the data is centered, the scores have zero mean ($\mathbf{1}^T\mathbf{z} = 0$), so their sample variance is exactly
\[\operatorname{Var}(\mathbf{z}) = \frac{1}{m-1}\mathbf{z}^T\mathbf{z} = \frac{1}{m-1}\mathbf{w}^T\mathbf{X}_c^T\mathbf{X}_c\mathbf{w} = \mathbf{w}^T\mathbf{C}\mathbf{w}.\]This is an equality, not mere proportionality, and it is why the covariance matrix appears. Since $\mathbf{w}$ fixes a direction, we constrain it to unit length, giving the PCA objective:
\[\max_{\mathbf{w}}\ \mathbf{w}^T\mathbf{C}\mathbf{w} \quad \text{subject to } \mathbf{w}^T\mathbf{w} = 1.\]Maximizing the unscaled $\lVert\mathbf{X}_c\mathbf{w}\rVert^2$ instead finds the same direction; it just reports the optimum as $\sigma_1^2 = (m-1)\lambda_1$ rather than the variance $\lambda_1$.
4. The Quadratic Form and the Eigenvalue Connection
The objective $\mathbf{w}^T\mathbf{C}\mathbf{w}$ is a quadratic form. Writing it from the unscaled norm shows the covariance matrix appearing directly: with $\mathbf{v}^T\mathbf{v} = \lVert\mathbf{v}\rVert^2$ and $(AB)^T = B^TA^T$,
\[\lVert\mathbf{X}_c\mathbf{w}\rVert^2 = (\mathbf{X}_c\mathbf{w})^T(\mathbf{X}_c\mathbf{w}) = \mathbf{w}^T(\mathbf{X}_c^T\mathbf{X}_c)\mathbf{w} = (m-1)\,\mathbf{w}^T\mathbf{C}\mathbf{w}.\]Maximizing a quadratic form under a unit-norm constraint is a standard eigenvalue problem. The next two sections solve it from both ends: the Lagrangian shows the solution must be an eigenvector of $\mathbf{C}$, and the Rayleigh quotient shows which eigenvector is the maximizer and what the maximum value is.
5. Solving via Lagrangian Multipliers
We can formally solve the maximization problem using the Lagrangian Multiplier method, which explicitly demonstrates the link between the optimal direction $\mathbf{w}$ and the eigenvectors.
Formulating the Lagrangian
We combine the objective function and the constraint into the Lagrangian function $L$:
\[L(\mathbf{w}, \lambda) = \mathbf{w}^T \mathbf{C} \mathbf{w} - \lambda (\mathbf{w}^T \mathbf{w} - 1)\]Where $\mathbf{C} = \mathbf{X}^T \mathbf{X}$ and $\lambda$ is the Lagrange multiplier.
Calculating the Gradient
To find the maximum, we take the gradient of $L$ with respect to $\mathbf{w}$ and set it to the zero vector ($\mathbf{0}$).
Gradient of the First Term ($\mathbf{w}^T \mathbf{C} \mathbf{w}$): The gradient of a quadratic form is $2\mathbf{C}\mathbf{w}$. (Since $\mathbf{C}$ is symmetric, $\mathbf{C} = \mathbf{C}^T$).
Gradient of the Second Term ($\lambda (\mathbf{w}^T \mathbf{w} - 1)$): The gradient is $2\lambda \mathbf{w}$.
Setting the gradient to zero:
\[\nabla_{\mathbf{w}} L(\mathbf{w}, \lambda) = 2\mathbf{C}\mathbf{w} - 2\lambda\mathbf{w} = \mathbf{0}\]Dividing by 2 and factoring out $\mathbf{w}$ yields:
\[\mathbf{C}\mathbf{w} = \lambda\mathbf{w}\]This final expression is the fundamental definition of the eigenvalue problem.
Which eigenvector? The Rayleigh quotient
The Lagrangian says the solution is an eigenvector, but $\mathbf{C}\mathbf{w} = \lambda\mathbf{w}$ holds at every eigenvector, including the variance minimum. To see which one maximizes, use that $\mathbf{C}$ is symmetric positive semidefinite, so its unit eigenvectors $\mathbf{v}_1,\dots,\mathbf{v}_n$ (with eigenvalues $\lambda_1 \ge \dots \ge \lambda_n \ge 0$) form an orthonormal basis. Expand any unit vector as $\mathbf{w} = \sum_j a_j\mathbf{v}_j$ with $\sum_j a_j^2 = 1$. Then
\[\mathbf{w}^T\mathbf{C}\mathbf{w} = \sum_j \lambda_j a_j^2 \le \lambda_1\sum_j a_j^2 = \lambda_1,\]with equality exactly when all the weight sits on the top eigenspace ($\mathbf{w} = \pm\mathbf{v}_1$). So the first principal component is the eigenvector of the largest eigenvalue, and the maximum projected variance is $\lambda_1$ itself. Two caveats fall straight out of the algebra: the sign of $\mathbf{v}_1$ is arbitrary, and if $\lambda_1$ is repeated the maximizing direction is not unique (only the leading subspace is).
All $k$ components at once
The later components are not a separate story. Collecting the top $k$ axes into $\mathbf{W}_k$ ($n\times k$), the joint problem is
\[\max_{\mathbf{W}_k^T\mathbf{W}_k = \mathbf{I}_k}\ \operatorname{tr}(\mathbf{W}_k^T\mathbf{C}\mathbf{W}_k),\]whose solution is $\mathbf{W}_k = [\mathbf{v}_1,\dots,\mathbf{v}_k]$, the eigenvectors of the $k$ largest eigenvalues. The orthonormality constraint $\mathbf{W}_k^T\mathbf{W}_k = \mathbf{I}_k$ is what forces each new axis to be orthogonal to the previous ones. Under this choice the covariance of the scores is diagonal,
\[\operatorname{Cov}(\mathbf{Z}) = \mathbf{W}_k^T\mathbf{C}\mathbf{W}_k = \operatorname{diag}(\lambda_1,\dots,\lambda_k),\]so the principal-component scores are uncorrelated in the training sample. (Uncorrelated is not the same as statistically independent; the two coincide only under extra assumptions such as joint Gaussianity.)
6. The Practical Solution: Connecting to SVD
In practice, libraries compute PCA from the Singular Value Decomposition (SVD) of the centered data matrix rather than forming and eigendecomposing $\mathbf{C}$ explicitly. Working on $\mathbf{X}_c$ directly avoids squaring the condition number (more numerically stable) and sidesteps building the $n\times n$ covariance matrix. Exactly when each solver is preferable depends on the matrix shape, which we return to in the solver notes later.
Derivation via SVD
Start with the SVD. The SVD of the centered matrix is $\mathbf{X}_c = \mathbf{U}\mathbf{\Sigma}\mathbf{V}^T$, where $\mathbf{U}$ holds the left singular vectors, $\mathbf{V}$ the right singular vectors, and $\mathbf{\Sigma}$ is the rectangular diagonal matrix of singular values $\sigma_i \ge 0$.
Form the Gram matrix $\mathbf{X}_c^T\mathbf{X}_c$:
\[\mathbf{X}_c^T\mathbf{X}_c = (\mathbf{U}\mathbf{\Sigma}\mathbf{V}^T)^T(\mathbf{U}\mathbf{\Sigma}\mathbf{V}^T)\]Apply the transpose rule $(\mathbf{A}\mathbf{B}\mathbf{C})^T = \mathbf{C}^T\mathbf{B}^T\mathbf{A}^T$:
\[\mathbf{X}_c^T\mathbf{X}_c = \mathbf{V}\mathbf{\Sigma}^T\mathbf{U}^T\mathbf{U}\mathbf{\Sigma}\mathbf{V}^T\]Use orthogonality $\mathbf{U}^T\mathbf{U} = \mathbf{I}$:
\[\mathbf{X}_c^T\mathbf{X}_c = \mathbf{V}\,(\mathbf{\Sigma}^T\mathbf{\Sigma})\,\mathbf{V}^T\]Here $\mathbf{\Sigma}^T\mathbf{\Sigma}$ is the $n\times n$ diagonal matrix of squared singular values $\sigma_i^2$. Writing $\mathbf{\Sigma}^2$ would be a shape error, since $\mathbf{\Sigma}$ is rectangular.
Divide by $m-1$ to recover the covariance matrix itself:
\[\mathbf{C} = \frac{1}{m-1}\mathbf{X}_c^T\mathbf{X}_c = \mathbf{V}\left(\frac{\mathbf{\Sigma}^T\mathbf{\Sigma}}{m-1}\right)\mathbf{V}^T\]
Observations. Comparing with the eigendecomposition $\mathbf{C} = \mathbf{V}\mathbf{\Lambda}\mathbf{V}^T$:
- The principal axes (eigenvectors of $\mathbf{C}$) are the columns of $\mathbf{V}$, the right singular vectors.
- The covariance eigenvalues, i.e. the explained variances, are $\lambda_j = \dfrac{\sigma_j^2}{m-1}$, not $\sigma_j^2$. The raw $\sigma_j^2$ are the eigenvalues of the unscaled Gram matrix.
- So a library runs one SVD of $\mathbf{X}_c$, reads the axes from $\mathbf{V}$, and reports the explained variances as $\sigma_j^2/(m-1)$.
Economy SVD and rank. The full shapes ($\mathbf{U}$ is $m\times m$, $\mathbf{\Sigma}$ is $m\times n$) are rarely materialized. With $r = \operatorname{rank}(\mathbf{X}_c) \le \min(m-1,\, n)$, the economy SVD keeps only
\[\mathbf{U}_r \in \mathbb{R}^{m\times r},\qquad \mathbf{\Sigma}_r \in \mathbb{R}^{r\times r},\qquad \mathbf{V}_r^T \in \mathbb{R}^{r\times n}.\]The $m-1$ (rather than $m$) ceiling on the rank is a direct consequence of centering: subtracting the mean confines every row to an $(m-1)$-dimensional affine subspace, removing one degree of freedom.
Recap of the Derivation
Three sections, one conclusion: the direction $\mathbf{w}$ of largest projected sample variance must be the eigenvector of $\mathbf{C}$ with the largest eigenvalue $\lambda_1$, and that eigenvalue is the variance captured. The next components are the eigenvectors of the following eigenvalues, orthogonal to the previous ones and capturing the largest remaining variance. SVD hands us all of them at once from $\mathbf{X}_c = \mathbf{U}\mathbf{\Sigma}\mathbf{V}^T$, with the axes in $\mathbf{V}$ and the variances in $\sigma_j^2/(m-1)$. What remains is turning those axes into an actual transform.
PCA in Practice: Projection and Reconstruction
When applying Principal Component Analysis (PCA) to reduce data from $n$ dimensions to $k$ dimensions (where $k \ll n$), we perform a specific sequence of matrix operations. This guide explains the exact linear algebra behind the Projection (Encoding) and Reconstruction (Decoding) phases using the Singular Value Decomposition (SVD) components.
1. The Setup
Let $\mathbf{X}_c = \mathbf{X} - \mathbf{1}\mu^T$ be the centered data matrix ($m\times n$), where $\mu$ is the feature-mean vector learned from the training data. We store $\mu$: it is needed both to project new points and to reconstruct. The economy SVD is
\[\mathbf{X}_c = \mathbf{U}\mathbf{\Sigma}\mathbf{V}^T,\]with the columns of $\mathbf{V}$ the principal axes, ordered by decreasing singular value. The rows of scikit-learn’s components_ are exactly these columns (i.e. $\mathbf{V}_k^T$).
2. Projection: Reducing Dimensions ($n \to k$)
Take the first $k$ columns of $\mathbf{V}$ as $\mathbf{V}_k$ (shape $n\times k$). The score matrix is the centered data projected onto those axes:
\[\mathbf{Z} = \mathbf{X}_c\mathbf{V}_k \qquad (m\times n)(n\times k) = (m\times k).\]Each row of $\mathbf{Z}$ is one sample in $k$ new coordinates, compressing the data from $n$ features to $k$. A new observation $\mathbf{x}_{\text{new}}$ is projected with the stored training mean, never a mean recomputed on the new batch (recomputing shifts the coordinate system and leaks information):
\[\mathbf{z}_{\text{new}} = (\mathbf{x}_{\text{new}} - \mu)^T\mathbf{V}_k.\]3. Lossy Reconstruction: The Reverse Process ($k \to n$)
Because the bottom $n-k$ components were discarded, reconstruction returns an approximation, not the original. First map the scores back into the centered feature space:
\[\hat{\mathbf{X}}_c = \mathbf{Z}\mathbf{V}_k^T = \mathbf{X}_c\mathbf{V}_k\mathbf{V}_k^T \qquad (m\times n).\]$\mathbf{V}_k\mathbf{V}_k^T$ is the orthogonal projector onto the top-$k$ subspace, so $\hat{\mathbf{X}}_c$ is the shadow of the centered data on that hyperplane. To land back in the original coordinate system, add the stored training mean:
\[\hat{\mathbf{X}} = \mathbf{Z}\mathbf{V}_k^T + \mathbf{1}\mu^T.\]Skipping this last step (as many quick derivations do) leaves the reconstruction centered, offset from the real data by $\mu$.
Reconstruction error and optimality. The information lost is the squared Frobenius norm of the residual, which equals the tail of discarded singular values:
\[\lVert\mathbf{X}_c - \hat{\mathbf{X}}_c\rVert_F^2 = \sum_{j > k}\sigma_j^2.\]By the Eckart-Young-Mirsky theorem, this truncated-SVD reconstruction is the best possible rank-$k$ approximation under both the Frobenius and spectral norms. That gives PCA its second, equivalent definition: maximizing retained variance ($\sum_{j\le k}\lambda_j$) is the same optimization as minimizing squared reconstruction error ($\sum_{j>k}\sigma_j^2$).
A Worked 2D Example
Nothing anchors the algebra like real numbers. Take five points and run the whole pipeline by hand:
\[\mathbf{X} = \begin{bmatrix} 2&3\\ 3&5\\ 4&4\\ 5&6\\ 6&7 \end{bmatrix}.\]1. Center. The feature means are $\mu = (4, 5)$, giving
\[\mathbf{X}_c = \begin{bmatrix} -2&-2\\ -1&0\\ 0&-1\\ 1&1\\ 2&2 \end{bmatrix}.\]2. Covariance. With $m = 5$,
\[\mathbf{C} = \frac{1}{4}\mathbf{X}_c^T\mathbf{X}_c = \frac{1}{4}\begin{bmatrix} 10&9\\ 9&10 \end{bmatrix} = \begin{bmatrix} 2.5&2.25\\ 2.25&2.5 \end{bmatrix}.\]3. Eigenpairs. A symmetric $2\times2$ matrix with equal diagonal entries has eigenvectors along $(1,1)$ and $(1,-1)$:
\[\lambda_1 = 4.75,\quad \mathbf{v}_1 = \tfrac{1}{\sqrt2}(1,1); \qquad \lambda_2 = 0.25,\quad \mathbf{v}_2 = \tfrac{1}{\sqrt2}(1,-1).\]4. Explained variance. $\operatorname{EVR}_1 = 4.75/5 = 0.95$: the first component alone captures 95% of the variance, which is why the points hug the $\mathbf{v}_1$ line in the figure below.
5. Project onto PC1. $z_i = \mathbf{x}_{c,i}^T\mathbf{v}_1 = (x_1+x_2)/\sqrt2$ gives scores $(-2.83,\ -0.71,\ -0.71,\ 1.41,\ 2.83)$.
6. Verify the variance identity. Their sample variance is $\frac{1}{4}\sum_i z_i^2 = \frac{19}{4} = 4.75 = \lambda_1$, exactly as the Rayleigh argument promised.
7. Reconstruct and restore the mean. Mapping the scores back onto $\mathbf{v}_1$ and adding $\mu$ returns rank-1 approximations on the $\mathbf{v}_1$ line: the three collinear points come back exactly, the two off-line points pick up a residual.
8. Reconstruction error. The singular values are $\sigma = (\sqrt{19},\ 1)$, so $\sigma_1^2/(m-1) = 19/4 = 4.75 = \lambda_1$ as required, and the discarded tail is $\sum_{j>1}\sigma_j^2 = \sigma_2^2 = 1$. Computing the squared Frobenius error directly also gives $1.0$, matching the identity.
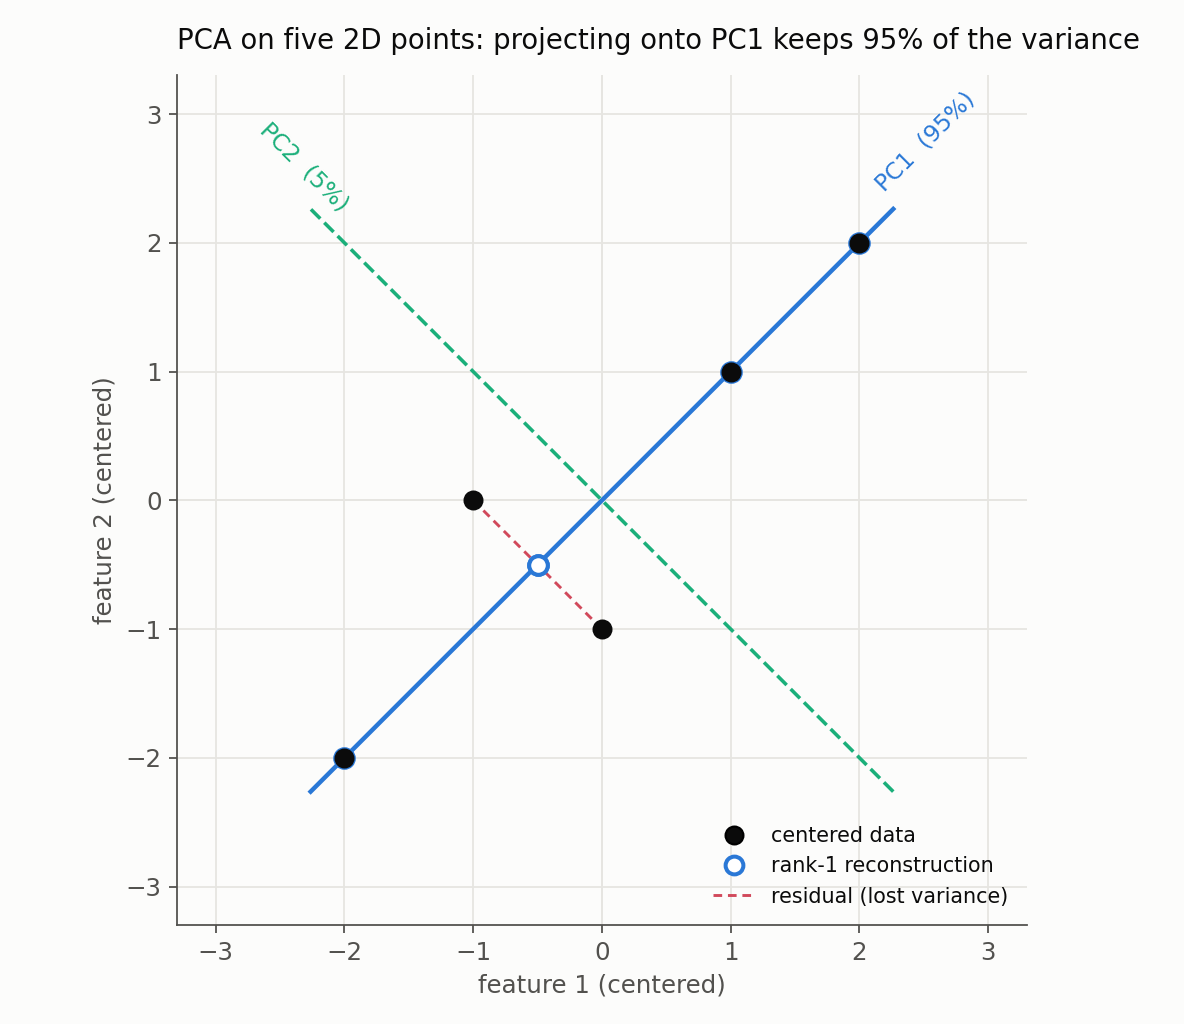
The residual segments are orthogonal to PC1 and parallel to PC2: the variance PCA discards is exactly the spread along the dropped direction. Three points already sit on PC1, so they reconstruct perfectly; only the two off-axis points contribute the total reconstruction error of $\sigma_2^2 = 1$.
The same thing in scikit-learn
1
2
3
4
5
6
7
8
9
10
11
12
13
14
import numpy as np
from sklearn.decomposition import PCA

X = np.array([[2,3],[3,5],[4,4],[5,6],[6,7]], float)
pca = PCA(n_components=1).fit(X)        # fit on TRAINING data only

pca.mean_                      # [4. 5.]           -> mu
pca.components_                # [[0.707 0.707]]   -> V_k^T  (axes as rows)
pca.explained_variance_        # [4.75]            -> lambda_j = sigma_j^2/(m-1)
pca.explained_variance_ratio_  # [0.95]
pca.singular_values_           # [4.359]           -> sigma_j

Z = pca.transform(X)                   # scores; uses the stored mean_
X_hat = pca.inverse_transform(Z)       # reconstruction; restores the mean
Every printed value matches the hand calculation. In a real pipeline the fit happens on training data inside a Pipeline (optionally after a StandardScaler), while validation and test sets are only ever transformed, so the stored mean_ and any scaler statistics never leak across the split.
How Many Components to Keep
The eigenvalues say how much variance each axis captures, so the natural budget is the explained-variance ratio:
\[\operatorname{EVR}_j = \frac{\lambda_j}{\sum_{q=1}^{r}\lambda_q} = \frac{\sigma_j^2}{\sum_{q=1}^{r}\sigma_q^2}.\](scikit-learn exposes this as explained_variance_ratio_.) Common ways to choose $k$:
- Cumulative-variance target: the smallest $k$ reaching, say, 90-95% of total variance. A default, not a law.
- Scree-plot elbow: plot the $\lambda_j$ and cut where the curve flattens.
- Held-out reconstruction error on representative data.
- Downstream cross-validation when PCA feeds a supervised model: pick the $k$ that helps the final metric, and pick it inside the CV loop.
- Budget constraints: memory, latency, or the fact that visualization needs $k = 2$ or $3$.
Resist treating 90% or 95% as universal. A low-variance direction can carry the signal that separates classes, while the top component may be pure measurement scale. Variance is a proxy for usefulness, not a guarantee of it.
Solver Notes: SVD Is Not Always the Answer
The common claim that “SVD is best for large, sparse data” needs qualifying, because the right solver is shape-dependent:
- Direct SVD of $\mathbf{X}_c$ avoids forming $\mathbf{X}_c^T\mathbf{X}_c$ and avoids squaring the condition number; it is the stable default.
- Covariance eigendecomposition can win when samples vastly outnumber a modest number of features, but materializing an $n\times n$ covariance is expensive for very wide data.
- Randomized or truncated solvers are efficient when only a few components are needed out of many.
- Sparse data is the catch. Centering a sparse matrix makes it dense, so ordinary PCA and sparse storage clash.
TruncatedSVDaccepts sparse input efficiently but does not center the data, so it is not identical to PCA.
scikit-learn’s PCA auto-selects among full, covariance-eigh, ARPACK, and randomized solvers based on the matrix shape and the number of components requested.
Limitations and Alternatives
PCA earns its ubiquity, but its assumptions are worth stating plainly. It is:
- linear - it can only find flat subspaces, and misses curved structure;
- unsupervised - it never sees labels, so its axes need not align with the prediction target;
- scale-sensitive - hence the centering-versus-standardization decision above;
- outlier-sensitive - variance is a squared-distance measure, so a few extreme points can swing an axis;
- restricted to orthogonal directions, which aids decorrelation but can limit interpretability;
- not causal or semantically identifiable - a component mixing many features may have no clean meaning.
Maximum variance is not synonymous with maximum usefulness: a high-variance direction may just reflect units, batch effects, or nuisance variation. When these limits bite, common alternatives are TruncatedSVD (uncentered sparse matrices such as term-document counts), IncrementalPCA (out-of-core or streaming batches), KernelPCA (nonlinear structure), SparsePCA (sparse, more interpretable loadings), and supervised reduction such as LDA when the projection should respect labels.
Whitening is a related option worth naming: it rescales the retained scores to unit variance, discarding their relative magnitudes. It is optional, distinct from PCA itself, and helps or hurts depending on the downstream model’s assumptions.
Resources
- Pearson, K. (1901). On Lines and Planes of Closest Fit to Systems of Points in Space. The London, Edinburgh, and Dublin Philosophical Magazine and Journal of Science (Series 6), 2(11), 559-572. (The geometric origin of PCA.)
- Hotelling, H. (1933). Analysis of a Complex of Statistical Variables into Principal Components. Journal of Educational Psychology, 24(6), 417-441.
- Eckart, C. & Young, G. (1936). The Approximation of One Matrix by Another of Lower Rank. Psychometrika, 1(3), 211-218. (The low-rank optimality theorem behind reconstruction.)
- Jolliffe, I. T. & Cadima, J. (2016). Principal Component Analysis: A Review and Recent Developments. Philosophical Transactions of the Royal Society A, 374(2065), 20150202.
- scikit-learn:
sklearn.decomposition.PCA- the solver choices and thecomponents_,explained_variance_,singular_values_, andinverse_transformAPI used above.