Logistic Regression, Part 1: From Log-Odds to Gradient Descent
Derive binary logistic regression from log-odds and Bernoulli likelihood, then train it using cross-entropy and numerical optimization.
Logistic Regression series: Part 1: From Log-Odds to Gradient Descent · Part 2: Coefficients, Decision Boundaries, and Limitations · Part 3: Softmax, Neural Networks, and Imbalanced Data
Logistic regression begins with a deceptively simple constraint: a linear score can range from negative to positive infinity, but a probability must remain between 0 and 1. Resolving that mismatch leads naturally to odds, the logit, the sigmoid, Bernoulli likelihood, and binary cross-entropy.
This first part builds that chain end to end using a basketball win-probability example. We will derive the loss, inspect its gradients, and explain why fitting the coefficients requires a numerical solver rather than a normal equation.
1. From a Linear Score to a Probability
In our basketball scenario, the feature is hours_practiced, and the target indicates whether the team wins. It seems intuitive to start with a line:
\[z = \beta_0 + \beta_1 \times \text{hours\_practiced}.\]But a linear score can take any value from negative to positive infinity, while a probability must remain between 0 and 1. Directly treating the score as a probability could produce impossible values such as $-0.5$ or $1.5$.
We resolve this mismatch by transforming the win probability $p$ in two steps:
- Odds: $\frac{p}{1-p}$ maps probabilities in $(0,1)$ to positive values in $(0,\infty)$.
- Log-odds (the logit): $\log\left(\frac{p}{1-p}\right)$ maps positive odds to the whole real line.
The ranges now match, so logistic regression models the log-odds as a linear function:
\[\log\left(\frac{P(\text{Win})}{1-P(\text{Win})}\right) = \beta_0 + \beta_1(\text{hours\_practiced}).\]If we call the linear score
\[z = \beta_0 + \beta_1(\text{hours\_practiced}),\]then solving the log-odds equation for the probability gives the sigmoid:
\[\hat p = \sigma(z) = \frac{1}{1 + e^{-z}}.\]Every real-valued score therefore maps to a value strictly between 0 and 1.
The two directions of this transform are mirror images. The logit stretches the bounded interval $(0,1)$ onto the whole real line, so a linear model has room to work; the sigmoid squashes the real line back into $(0,1)$, so the output is always a valid probability.
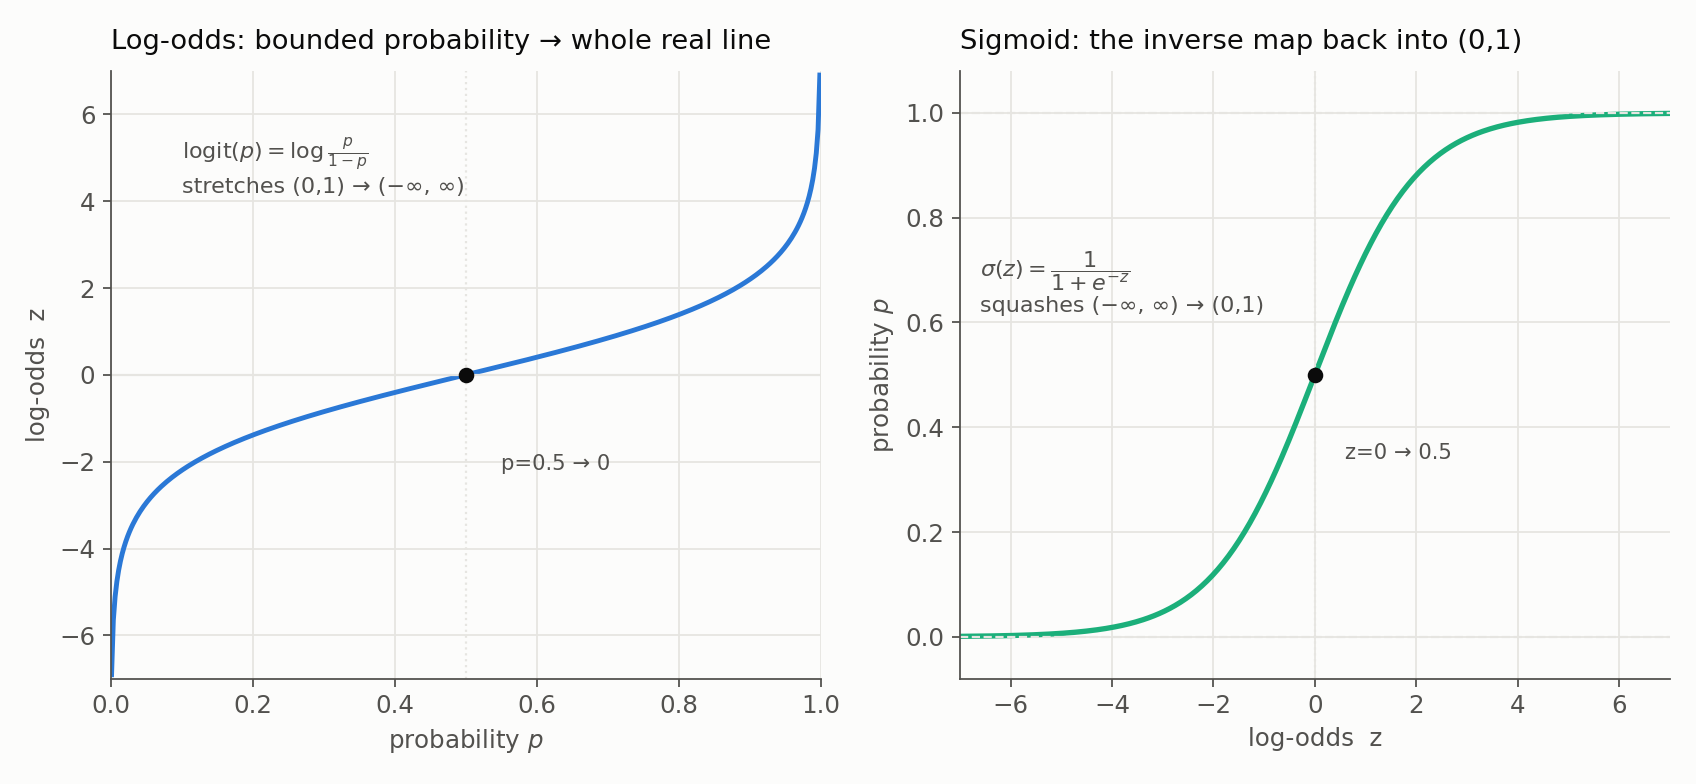
Both curves pass through the same anchor: $p = 0.5$ corresponds to $z = 0$. That is the point of maximum uncertainty, and it will reappear as the decision boundary once we start classifying.
2. Bernoulli Likelihood and Binary Cross-Entropy
For each game, let $y_i \in \{0,1\}$ indicate a loss or win and let $\hat p_i=P(Y_i=1\mid x_i)$ be the probability predicted by the sigmoid. The appropriate observation model is Bernoulli:
\[P(y_i\mid x_i;\beta)=\hat p_i^{y_i}(1-\hat p_i)^{1-y_i}.\]Assuming the games are conditionally independent, the likelihood of the full dataset is:
\[L(\beta)=\prod_{i=1}^{m}\hat p_i^{y_i}(1-\hat p_i)^{1-y_i}.\]Maximum Likelihood Estimation asks which coefficients make the observed wins and losses most probable. Products of many probabilities are inconvenient and can underflow numerically, so we take the log. Because the logarithm is strictly increasing, maximizing log-likelihood gives the same coefficients as maximizing likelihood:
\[\log L(\beta)=\sum_{i=1}^{m}\left[y_i\log(\hat p_i)+(1-y_i)\log(1-\hat p_i)\right].\]Negating and averaging produces binary cross-entropy, also called log loss:
\[J(\beta)=-\frac{1}{m}\sum_{i=1}^{m}\left[y_i\log(\hat p_i)+(1-y_i)\log(1-\hat p_i)\right].\]This is not an arbitrary classification penalty. It is the negative log-likelihood of the Bernoulli model. For logistic regression, its Hessian has the form $X^TWX$, where $W$ is diagonal with non-negative entries $\hat p_i(1-\hat p_i)$. The objective is therefore convex. Strict uniqueness additionally depends on the design matrix and regularization; with complete class separation, the unregularized finite MLE may not exist because coefficient magnitudes can grow without bound.
3. Cross-Entropy Versus Squared Error
Squared error is the negative log-likelihood associated with a Gaussian response model when the noise variance is constant:
\[Y_i\mid X_i=x_i \sim \mathcal N(\hat y_i,\sigma^2) \quad\Longrightarrow\quad -\log L \propto \sum_i(y_i-\hat y_i)^2.\]A binary label instead follows a Bernoulli distribution, which leads directly to cross-entropy. That likelihood match is the main statistical reason logistic regression uses log loss.
Squared error is not meaningless for binary probabilities. The mean squared probability error is the Brier score, a proper scoring rule. It is useful for evaluating probabilistic predictions. The difficulty comes from using it as the training objective for a sigmoid-parameterized model. Its gradient with respect to the score contains an additional sigmoid factor:
\[\frac{\partial L_{\text{MSE}}}{\partial z} = 2(\hat p-y)\hat p(1-\hat p).\]When a confidently wrong prediction saturates near 0 or 1, $\hat p(1-\hat p)$ becomes tiny and learning can slow dramatically. With cross-entropy, the corresponding derivative simplifies to:
\[\frac{\partial L_{\text{CE}}}{\partial z}=\hat p-y.\]The cross-entropy loss becomes arbitrarily large as a prediction approaches the wrong extreme, while the gradient with respect to the logit approaches $-1$ or $+1$. The gradient is strong and non-vanishing, not infinite.
4. A Worked Binary Cross-Entropy Example
Suppose the three observed outcomes are $y_1=1$, $y_2=0$, and $y_3=1$. What does their combined loss look like?
Recall that the general Log Loss formula for a single sample is:
\[\text{Loss}_i = -[y_i \log(\hat{p}_i) + (1-y_i) \log(1-\hat{p}_i)]\]This formula acts like a “switch.” Since $y$ can only be 0 or 1, one of the two terms inside the brackets always becomes zero and disappears.
Here is how the loss function looks for our specific dataset where $m=3$:
Step-by-Step Breakdown
1. Sample 1 ($y_1 = 1$)
We plug $y_1=1$ into the formula:
\[1 \cdot \log(\hat{p}_1) + (1-1) \cdot \log(1-\hat{p}_1)\]- The second part becomes $0 \cdot \dots$ and vanishes.
- Result: $\log(\hat{p}_1)$
2. Sample 2 ($y_2 = 0$)
We plug $y_2=0$ into the formula:
\[0 \cdot \log(\hat{p}_2) + (1-0) \cdot \log(1-\hat{p}_2)\]- The first part becomes $0 \cdot \dots$ and vanishes.
- Result: $\log(1-\hat{p}_2)$
3. Sample 3 ($y_3 = 1$)
We plug $y_3=1$ into the formula:
\[1 \cdot \log(\hat{p}_3) + (1-1) \cdot \log(1-\hat{p}_3)\]- The second part vanishes again.
- Result: $\log(\hat{p}_3)$
The Final Combined Loss Function
To get the total cost function $J(\beta)$, we sum these individual results, multiply by -1, and average them (divide by 3).
\[J(\beta) = -\frac{1}{3} \left[ \underbrace{\log(\hat{p}_1)}_{\text{Sample 1}} + \underbrace{\log(1 - \hat{p}_2)}_{\text{Sample 2}} + \underbrace{\log(\hat{p}_3)}_{\text{Sample 3}} \right]\]Interpretation
Notice what the math is telling the model to do to minimize the loss:
- For Sample 1 & 3: Maximize $\hat{p}$ (push the probability of winning close to 1).
- For Sample 2: Maximize $1 - \hat{p}$ (which means pushing $\hat{p}$ close to 0, or “not winning”).
Let’s visualize Gradient Descent as a hiker trying to walk down a hill blindfolded to find the lowest point (minimum loss).
5. Connecting the Loss to Gradient Descent
Here is how one update works for the three outcomes $y_1=1$, $y_2=0$, and $y_3=1$.
a. The Gradient Formulas
For the intercept:
\[\frac{\partial J}{\partial \beta_0} = \frac{1}{3}\sum_{i=1}^{3}(\hat p_i-y_i).\]For the practice-hours coefficient:
\[\frac{\partial J}{\partial \beta_1} = \frac{1}{3}\sum_{i=1}^{3}(\hat p_i-y_i)x_i.\]The first gradient is the average probability residual. The second weights each residual by its feature value.
b. One Internally Consistent Iteration
Suppose the current coefficients are $\beta_0=-1$ and $\beta_1=0.02$. For practice hours $x_1=10$, $x_2=100$, and $x_3=30$, the model produces:
| Sample | $x_i$ | $y_i$ | $z_i=-1+0.02x_i$ | $\hat p_i=\sigma(z_i)$ | $\hat p_i-y_i$ |
|---|---|---|---|---|---|
| 1 | 10 | 1 | -0.8 | 0.310 | -0.690 |
| 2 | 100 | 0 | 1.0 | 0.731 | 0.731 |
| 3 | 30 | 1 | -0.4 | 0.401 | -0.599 |
All three probabilities come from the same coefficient vector. The two wins pull their predicted probabilities upward, while the loss at 100 hours pulls its probability downward.
c. Updating the Intercept
The intercept gradient is:
\[\frac{\partial J}{\partial\beta_0} = \frac{-0.690+0.731-0.599}{3} \approx -0.186.\]With learning rate $\alpha$, gradient descent applies:
\[\beta_0^{\text{new}} = \beta_0^{\text{old}}-\alpha\frac{\partial J}{\partial\beta_0}.\]Because the gradient is negative, the update increases the intercept slightly, raising the baseline predicted win probability.
d. Updating the Practice-Hours Coefficient
The slope gradient is:
\[\frac{\partial J}{\partial\beta_1} = \frac{(-0.690)(10)+(0.731)(100)+(-0.599)(30)}{3} \approx 16.08.\]This positive gradient makes gradient descent decrease $\beta_1$. The loss after 100 practice hours provides strong evidence against the current positive slope.
This example also shows why feature scale matters for first-order optimization: large feature values can create large gradient components. Standardizing features often improves numerical conditioning, especially when several predictors use very different units.
Summary
One gradient-descent step:
- computes probabilities from the current coefficients;
- calculates probability residuals $\hat p_i-y_i$;
- aggregates those residuals into coefficient gradients; and
- moves each coefficient in the opposite direction.
6. Deriving the Intercept Gradient
Here is the step-by-step derivation. It is a beautiful piece of calculus because several complex terms cancel each other out perfectly to yield a simple final result.
To find the gradient $\frac{\partial J}{\partial \beta_0}$, we must use the Chain Rule.
The Setup
We have four linked components:
The Cost Function ($J$): The average of the individual losses ($L$).
\[J = \frac{1}{m} \sum_{i=1}^m L_i\]The Loss Function ($L$) for a single sample:
\[L = -[y \ln(\hat{p}) + (1-y) \ln(1-\hat{p})]\]The Prediction ($\hat{p}$): The sigmoid of the linear input ($z$).
\[\hat{p} = \sigma(z) = \frac{1}{1+e^{-z}}\]The Linear Input ($z$):
\[z = \beta_0 + \beta_1 x_1\]
The Chain Rule
To find how the single-sample loss $L$ changes when $\beta_0$ changes, we follow the chain:
\[\beta_0 \rightarrow z \rightarrow \hat{p} \rightarrow L\]Mathematically:
\[\frac{\partial L}{\partial \beta_0} = \frac{\partial L}{\partial \hat{p}} \times \frac{\partial \hat{p}}{\partial z} \times \frac{\partial z}{\partial \beta_0}\]Let’s calculate these three partial derivatives one by one.
Step 1: Derivative of Loss w.r.t. Prediction ($\frac{\partial L}{\partial \hat{p}}$)
\[L = -y \ln(\hat{p}) - (1-y) \ln(1-\hat{p})\]Recall that the derivative of $\ln(x)$ is $\frac{1}{x}$.
\[\frac{\partial L}{\partial \hat{p}} = -y \left(\frac{1}{\hat{p}}\right) - (1-y) \left(\frac{1}{1-\hat{p}} \cdot (-1)\right)\](Note: The -1 at the end comes from the chain rule derivative of $(1-\hat{p})$)
\[\frac{\partial L}{\partial \hat{p}} = -\frac{y}{\hat{p}} + \frac{1-y}{1-\hat{p}}\]Now, let’s combine these into a single fraction:
\[\frac{\partial L}{\partial \hat{p}} = \frac{-y(1-\hat{p}) + \hat{p}(1-y)}{\hat{p}(1-\hat{p})}\] \[\frac{\partial L}{\partial \hat{p}} = \frac{-y + y\hat{p} + \hat{p} - y\hat{p}}{\hat{p}(1-\hat{p})}\] \[\frac{\partial L}{\partial \hat{p}} = \frac{\hat{p} - y}{\hat{p}(1-\hat{p})}\]Step 2: Derivative of Prediction w.r.t. z ($\frac{\partial \hat{p}}{\partial z}$)
This is the derivative of the sigmoid function $\sigma(z)$. A unique property of the sigmoid function is that its derivative can be expressed using the function itself.
\[\sigma'(z) = \sigma(z)(1 - \sigma(z))\] \[\frac{\partial \hat{p}}{\partial z} = \hat{p}(1 - \hat{p})\]Step 3: Derivative of z w.r.t. $\beta_0$ ($\frac{\partial z}{\partial \beta_0}$)
Since $z = \beta_0 + \beta_1 x$:
\[\frac{\partial z}{\partial \beta_0} = 1\](Because $\beta_0$ is just an intercept constant).
Step 4: Putting it all together (The “Magic” Cancellation)
Now we multiply the three parts together:
\[\frac{\partial L}{\partial \beta_0} = \left[ \frac{\hat{p} - y}{\hat{p}(1-\hat{p})} \right] \times \left[ \hat{p}(1-\hat{p}) \right] \times [1]\]Notice that the denominator from Step 1 perfectly cancels out the result from Step 2!
\[\frac{\partial L}{\partial \beta_0} = (\hat{p} - y)\]Final Step: Summing over all samples
The calculation above was for a single sample. The total cost function $J$ is the average over all $m$ samples. So, we sum this result for all samples and divide by $m$.
\[\frac{\partial J}{\partial \beta_0} = \frac{1}{m} \sum_{i=1}^{m} (\hat{p}_i - y_i)\]And there is our formula: the gradient of the intercept is simply the average error of the predictions.
For every coefficient at once, let $X$ include the intercept column and let $\hat p$ and $y$ be vectors. The same result becomes:
\[\nabla_\beta J=\frac{1}{m}X^T(\hat p-y).\]This compact vector form is what numerical solvers evaluate repeatedly.
7. Why Setting the Gradient to Zero Does Not Give a Closed Form
This looks like a paradox, but it is actually the crucial distinction between finding the derivative and solving the equation.
It is not contradictory. Here is the nuance:
- Yes, we can calculate the gradient: We derived the formula $\frac{\partial J}{\partial \beta_0} = \frac{1}{m} \sum (\hat{p}_i - y_i)$. This formula tells us the slope of the cost function for any specific value of $\beta$.
- No, we cannot solve for $\beta$ when we set that gradient to zero: We cannot algebraically isolate $\beta$ to find the bottom of the cost function directly.
Let’s walk through the math to see exactly where the “trap” is.
The Trap: Expanding $\hat{p}$
The gradient formula looks deceptively simple:
\[\sum (\hat{p}_i - y_i) = 0\]It looks like we could just move $y$ to the other side and be done. But remember, $\hat{p}$ is not a constant number. It is a function that contains the very $\beta$ values we are trying to find.
If we expand $\hat{p}$ back into its full form, the equation we are trying to solve becomes:
\[\sum_{i=1}^{m} \left( \frac{1}{1 + e^{-(\beta_0 + \beta_1 x_i)}} - y_i \right) = 0\]Now, try to solve this equation for $\beta_0$.
Move $y$ to the right:
\[\sum_{i=1}^{m} \frac{1}{1 + e^{-(\beta_0 + \beta_1 x_i)}} = \sum_{i=1}^{m} y_i\]Stuck! We have a sum of sigmoid functions on the left. The $\beta_0$ term is trapped:
- Inside a negative exponent…
- Which is inside a denominator…
- Which is inside a summation.
There is no algebraic rule that allows us to “unpack” the $\beta_0$ from that summation. We cannot factor it out. This is what makes it a transcendental equation.
Comparison: Why Linear Regression CAN do it
Let’s look at why standard Linear Regression doesn’t have this problem.
In Linear Regression, the prediction is simple: $\hat{y} = \beta x$. The gradient (setting it to 0) looks like this:
\[\sum (\hat{y}_i - y_i) \cdot x_i = 0\]Substitute $\hat{y}$ with $\beta x$:
\[\sum (\beta x_i - y_i) \cdot x_i = 0\]Now watch how easy it is to isolate $\beta$:
Distribute the $x$:
\[\sum (\beta x_i^2 - y_i x_i) = 0\]Split the sum (Linearity allows this!):
\[\beta \sum x_i^2 - \sum y_i x_i = 0\]Move one term to the right:
\[\beta \sum x_i^2 = \sum y_i x_i\]SOLVED:
\[\beta = \frac{\sum y_i x_i}{\sum x_i^2}\]
See the difference?
- In Linear Regression, $\beta$ is just multiplied by $x$. We can factor it out of the sum and isolate it on the left side.
- In Logistic Regression, $\beta$ is trapped inside the non-linear sigmoid function inside the sum. We can calculate the value of the gradient for any given $\beta$, but we cannot write a formula that says $\beta = \dots$
That is why we need numerical optimization. Since we cannot jump directly to a closed-form answer, an iterative solver uses gradients (and sometimes curvature) to approach the optimum.
Numerical solvers use this gradient information in different ways. Gradient descent takes first-order steps; Newton-Raphson and Iteratively Reweighted Least Squares use curvature; production libraries commonly offer L-BFGS, SAG, or SAGA depending on the dataset and penalty.
Resources
We can now fit a binary probability model, but its coefficients live on the log-odds scale rather than the probability scale. Part 2 explains how to interpret those coefficients, how they define a decision boundary, and where that linear geometry reaches its limit.