Stats Primer: A Detailed Look at z & t-statistic
Part of the statistical-inference arc. It builds on p-values and confidence intervals and sets up A/B testing.
Prelude: The Central Limit Theorem (CLT)
Before diving into null hypotheses and p-values, it is helpful to understand the mathematical phenomenon that underpins large-sample inference: the Central Limit Theorem (CLT). It is what makes the arithmetic of A/B testing work by rendering many test statistics approximately normal. It is not, on its own, what makes an experiment valid (a point we return to below).
At its core, the CLT describes how the distribution of sample averages behaves when we draw many independent observations from the same distribution. The most powerful takeaway is this: even if the original distribution of our data is not normal, the distribution of the sample mean becomes approximately normal as the sample size grows.
The Intuition
Fundamentally, each observation contributes a small amount of randomness. When many independent contributions accumulate, their combined effect tends to look Gaussian.
Mathematically, if we draw a large sample $n$, the sample mean $\bar{X}_n$ becomes approximately normal:
\[\bar{X}_n \approx \mathcal{N} \left(\mu, \frac{\sigma^2}{n} \right)\]Formal Statement (Classical CLT)
Let $X_1, X_2, \dots, X_n$ be independent and identically distributed (i.i.d.) random variables with:
- Mean: $\mathbb{E}[X_i] = \mu$
- Variance: $\text{Var}(X_i) = \sigma^2 < \infty$
Define the sample mean:
\[\bar{X}_n = \frac{1}{n}\sum_{i=1}^{n}X_i\]Then as ($n \to \infty$):
\[\frac{\bar{X}_n - \mu}{\sigma/\sqrt{n}} \xrightarrow{d} \mathcal{N}(0,1)\]where ( $\xrightarrow{d}$ ) means convergence in distribution.
Why It Matters
The CLT explains why normal distributions appear everywhere in statistics and data science. It justifies:
- Confidence intervals
- Hypothesis testing
- Approximation of sampling distributions
- Many statistical models
Key Conditions
The classical CLT requires:
- Independence
- Identical distribution
- Finite variance
There are generalized versions (Lindeberg–Feller CLT) that relax the identical distribution assumption.
Although CLT is often first taught for the sample mean, but its reach is much broader. In fact, many common sample statistics become approximately normal (after appropriate scaling) because they can be expressed as functions of averages or sums of random variables.
A useful guiding principle is:
If a statistic can be written as a smooth function of sample averages, then a version of the CLT typically applies (via the Delta Method).
This includes:
| Statistic | Asymptotically Normal? |
|---|---|
| Sample mean | ✔ |
| Sample proportion | ✔ |
| Sample variance | ✔ |
| Sample standard deviation | ✔ |
| Difference of means | ✔ |
| Sample covariance | ✔ |
| MLE estimators | ✔ |
| Quantiles/median | ✔ |
Two caveats keep this honest. First, these results hold under regularity conditions (finite variance, and independence or correctly modeled dependence), not universally. Second, not every entry reaches normality by the same route: the sample median is asymptotically normal under conditions on the density near the quantile, but it is not a smooth function of averages, so the delta-method rationale does not actually cover it. Treat the guiding principle as a good heuristic, not a theorem for every statistic.
And a more important limit: the CLT delivers a sampling distribution, not a valid experiment. Random assignment, an appropriate unit of analysis, independence (or correctly modeled dependence), and reliable measurement are what make a comparison trustworthy. A perfectly normal test statistic computed on a badly designed study is still misleading.
1. What is Hypothesis Testing?
Hypothesis testing is a statistical framework used to determine if observed data provides enough evidence to support a specific belief about a population. It involves comparing a sample’s metric (like a mean or proportion) against a known value or another sample to see if the difference is “real” or just due to random chance.
To perform a test, we establish two opposing hypotheses:
- Null Hypothesis ($H_0$): This is the default position or the “status quo.” It assumes there is no relationship, no difference, or that an effect does not exist.
- For a one-proportion test, it assumes the population proportion equals a specific value ($p = p_0$).
- For a two-proportion test, it assumes the proportions of two groups are equal ($p_1 = p_2$).
- Alternative Hypothesis ($H_a$): This is the claim we are trying to validate. It assumes there is a significant difference or effect.
- For example, in a two-proportion test, it assumes $p_1 \neq p_2$.
2. Z-Statistic and T-Statistic: Bird’s Eye View
Z-statistic (Z-score)
A z-statistic measures how many standard errors our sample estimate (e.g. sample mean) is away from the hypothesized population value (e.g. population mean) when the population standard deviation is known (or the sample is large enough for CLT to apply).
\[z = \frac{\hat{\theta} - \theta_0}{\sigma / \sqrt{n}}\]Where:
- ($\theta_0$) = hypothesized value
- ($\sigma$) = population standard deviation
- ($n$) = sample size
Intuition:
It tells us how “extreme” our sample is under a normal distribution with known variance.
T-statistic
A t-statistic measures how many estimated standard errors our sample is away from the hypothesized value when the population standard deviation is unknown and must be estimated from the sample.
\[t = \frac{\hat{\theta} - \theta_0}{s / \sqrt{n}}\]Where:
- ($s$) = sample standard deviation
- Degrees of freedom = ($n - 1$) (or a variant for two samples)
Intuition:
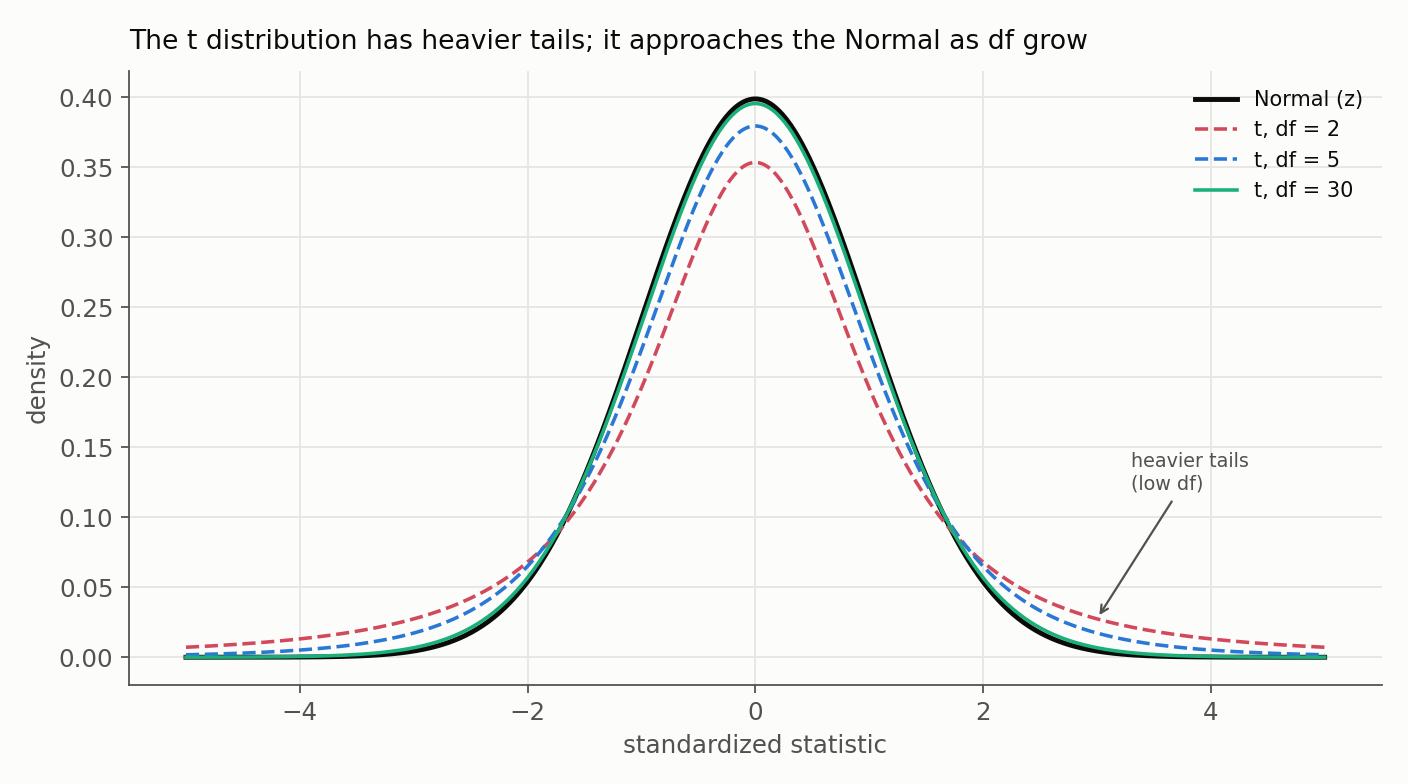
It accounts for extra uncertainty from estimating the variance, especially for small samples. It uses the t-distribution, which has heavier tails than the normal distribution.
In one sentence
- Z-statistic: use when variance is known; standardized difference measured using a normal distribution.
- T-statistic: use when variance is unknown; standardized difference measured using a t-distribution with heavier tails.
A common pitfall: “z for large samples, t for small”
This shorthand is not quite right. A large $n$ does not make the population standard deviation known; it only makes the estimated SD more precise, so the t-statistic simply approaches the z as the degrees of freedom grow. The heavier tails of the t are its way of accounting for having estimated the spread, and by roughly $df = 30$ the two nearly coincide. The real question is whether the standard deviation is known (z) or estimated from the data (t), not the sample size.
Proportions are the special case where a z-test is standard even for a single sample: the variance $p(1-p)$ is pinned down by the mean, so once we estimate the proportion there is no separate standard deviation left to estimate.
3. Hypothesis Testing: P-Value vs. Critical Value (Confidence Interval)
There are two interchangeable ways to make a decision in hypothesis testing. Both methods rely on a Significance Level ($\alpha$), typically set at 0.05, which is the probability of a Type I error (False Positive).
1. The P-Value Approach: The p-value is the probability of observing a result as extreme as the one we observed if the Null Hypothesis were true (i.e. just by sheer luck).
- Decision Rule: If the p-value is less than $\alpha$, we reject the Null Hypothesis.
- If the p-value is high (e.g., 0.35), we fail to reject $H_0$: the data do not provide sufficient evidence against the null. This is not proof of “no effect”, it can equally reflect low power or a wide range of plausible effects, which is why a p-value should always travel with an effect estimate and confidence interval.
2. The Critical Value (Confidence Interval) Approach: The critical value is the “line in the sand” on the distribution curve.
- For a standard Z-test with $\alpha = 0.05$, the critical values are $\pm 1.96$ ($Z_{\alpha/2}$).
- Decision Rule: If our calculated Z-statistic or T-statistic exceeds the critical value (e.g., $Z_{score} > 1.96$), the result falls into the rejection region, and we reject $H_0$.
Three views of one decision: The p-value, the rejection region, and the confidence interval are not a parametric-versus-nonparametric split; they are three summaries of the same inference. The p-value grades incompatibility with the null, the rejection region is a pre-specified decision rule, and the confidence interval reports the range of parameter values compatible with the data. Permutation tests and bootstrapping compute these same summaries without relying on a closed-form distribution.
4. Use Cases: When to Use Which Test?
- 1-Sample Test (z, t-stat): Used when we have one group and want to compare its statistic to a known, stable, or fixed population value.
- Examples: Manufacturing quality control (comparing bolts to a spec) or comparing student scores to a national average.
- 2-Sample Test (z, t-stat): Used when we have two independent groups and want to compare them to each other to see if they are different.
- Examples: A/B testing (Control vs. Variant) or comparing medical drug efficacy vs. placebo.
- 1-Proportion Test (z-stat only): Used for categorical data (success/failure) for a single group against a benchmark.
- Example: Validating a vendor’s claim that their defect rate is 2%.
- 2-Proportion Test (z-stat only): Used for categorical data comparing two independent groups.
- Example: Comparing conversion rates of two website designs.
Before the Formula: Design Assumptions
A test statistic is only as trustworthy as the design feeding it. Fix these before reaching for a formula:
- Units. The experimental unit, the randomization unit, and the analysis unit should agree. A large user count does not repair session-level pseudoreplication (treating repeated observations from one user as independent) or interference between users.
- Independence and clustering. If randomization is by cluster (store, region, account), the effective sample size is the number of clusters, not rows, and the standard error must reflect that.
- Sidedness. Choose a one- or two-sided alternative in advance. Picking the side after seeing the estimate invalidates the p-value.
- Outcome type. Binary, continuous, or count determines the standard-error form and therefore the test.
The choice of test follows the estimand and the design, not the other way around:
| Outcome and design | Primary procedure | Main caution |
|---|---|---|
| Continuous, two independent groups | Welch’s t-test | Outliers, clustering, skew at small samples |
| Continuous, repeated on the same units | Paired analysis | The pairing must be preserved |
| Binary, two independent groups | Two-proportion z (pooled test, unpooled CI) | Sparse expected counts, unit independence |
| Cluster-randomized outcome | Cluster-aware estimator/SE | User count is not the effective sample size |
5. Hypothesis Testing via Z-Test (Means)
1-Sample Z-Test Example
Formulation: Used when comparing a sample mean ($\bar{x}$) to a known population mean ($\mu_0$).
\[Z = \frac{\bar{x} - \mu_0}{\frac{\sigma}{\sqrt{n}}}\]- $\bar{x}$: Sample mean
- $\mu_0$: Hypothesized population mean
- $\sigma$: Population standard deviation
- $n$: Sample size
- Scenario: A factory targets a bolt diameter of $\mu_0 = 15$ mm, and the process has a known population standard deviation $\sigma = 0.2$ mm. We collect a sample of $n = 100$ bolts to check whether the machine has drifted away from that 15 mm target. (Note $\mu_0 = 15$ is the hypothesized target, distinct from the sample mean $\bar{x}$ we are about to observe.)
- Hypothesis: $H_0: \mu = 15$; $H_a: \mu \neq 15$. This is a two-tailed test.
Critical Value: At ($\alpha$ = 0.05), the two-tailed critical value is:
\[Z_{\text{crit}} = \pm 1.96\]If the absolute Z-score exceeds 1.96, we reject ($H_0$).
Calculation: Suppose the sample mean we observed is: $\bar{x} = 15.05 \text{mm}$
Then:
\[Z = \frac{15.05 - 15}{0.2 / \sqrt{100}} = \frac{0.05}{0.02} = 2.5\]- Decision Rule: Since ($Z = 2.5$) and ($2.5 > 1.96$) we reject the null hypothesis.
- Conclusion: Because the Z-statistic exceeds the critical threshold, there is statistically significant evidence at the 5% level that the machine’s mean bolt diameter is no longer 15 mm.
- Action: The machine should be recalibrated.
2-Sample Z-Test Example
Formulation: Used when comparing two independent sample means, assuming both populations have known standard deviations.
\[Z = \frac{\bar{x}_1 - \bar{x}_2}{\sqrt{\frac{\sigma_1^2}{n_1} + \frac{\sigma_2^2}{n_2}}}\]- ($\bar{x}_1$, $\bar{x}_2$): Sample means
- ($\sigma_1$, $\sigma_2$): Population standard deviations
- ($n_1$, $n_2$): Sample sizes for the two groups
- Scenario: A company uses two different packing machines (Machine A and Machine B) to fill cereal boxes. Historically, both machines have very stable fill weights with known population standard deviations ($\sigma_1 = \sigma_2 = 5$) grams. We want to test whether the machines fill differently.
- Sample from Machine A: ($n_1 = 64$), ($\bar{x}_1 = 502\text{g}$)
- Sample from Machine B: ($n_2 = 64$), ($\bar{x}_2 = 498\text{g}$)
- Hypothesis: $H_0 : \mu_1 = \mu_2; H_a : \mu_1 \neq \mu_2$. This is a two-tailed test.
Critical Value: At ($\alpha = 0.05$), the two-tailed critical value is:
\[Z_{\text{crit}} = \pm 1.96\]If the absolute Z-score exceeds 1.96, we reject ($H_0$).
Calculation:
\[Z = \frac{502 - 498}{\sqrt{5^2/64 + 5^2/64}} = \frac{4}{\sqrt{0.390625 + 0.390625}} = \frac{4}{\sqrt{0.78125}} = \frac{4}{0.884} \approx 4.52\]- Decision Rule: Since ($Z = 4.52$) and (4.52 > 1.96), we reject the null hypothesis.
- Conclusion: There is statistically significant evidence at the 5% level that the two packing machines produce different mean fill weights.
- Action: The company should investigate calibration differences between Machine A and Machine B.
1-Proportion Z-Test Example
Formulation: Used when comparing a sample proportion ($\hat{p}$) to a hypothesized population proportion ($p_0$).
\[Z = \frac{\hat{p} - p_0}{\sqrt{\frac{p_0(1 - p_0)}{n}}}\]- ($\hat{p}$): Sample proportion
- ($p_0$): Hypothesized proportion
- ($n$): Sample size
Scenario: A website historically has a signup conversion rate of 12%. A new landing page design is tested on a sample of (n = 500) visitors. We want to check whether the conversion rate has changed. Suppose we observe 70 signups, so:
\[\hat{p} = \frac{70}{500} = 0.14\]- Hypothesis: $H_0 : p = 0.12$; $H_a : p \neq 0.12$. This is a two-tailed test.
Critical Value: At ($\alpha = 0.05$), the two-tailed critical value is:
\[Z_{\text{crit}} = \pm 1.96\]Reject $H_0$ if ($\lvert Z \rvert > 1.96$).
Calculation:
\[Z = \frac{0.14 - 0.12}{\sqrt{\frac{0.12(0.88)}{500}}} = \frac{0.02}{\sqrt{0.0002112}} = \frac{0.02}{0.01453} \approx 1.38\]- Decision Rule: Since (Z = 1.38) and (1.38 < 1.96), we fail to reject the null hypothesis.
- Conclusion: There is not enough evidence to conclude that the new landing page changed the true conversion rate.
- Action: The current design does not show a statistically significant uplift; consider testing additional variations or increasing sample size.
Derivation of the Standard Error (SE)
In the 1-proportion z-test, the standard error (SE) formula is:
\[SE = \sqrt{\frac{p_0(1-p_0)}{n}}\]a. Building Block: The Bernoulli Trial
Every single data point in a proportion test is a binary outcome (Success/Failure, Click/No-Click). This is modeled as a Bernoulli random variable, let’s call it $X$.
- If Success ($X=1$): Probability is $p_0$.
- If Failure ($X=0$): Probability is $1 - p_0$.
The Variance of a single Bernoulli trial is a known property:
\[Var(X) = p_0(1 - p_0)\]b. The Sample Proportion
When we run a test, we don’t look at just one data-point, we calculate the sample proportion ($\hat{p}$) from a sample of size $n$.
(This is essentially the average of all the 1s and 0s).
c. Variance of the Sample Proportion
To find the variance of this new variable $\hat{p}$, we apply the rules of variance to the formula above. Since the observations are independent, their variances add up.
When we pull a constant (like $1/n$) out of a variance calculation, it gets squared:
\[Var(\hat{p}) = \frac{1}{n^2} \sum Var(X_i)\]Since we have $n$ identical trials, the sum of their variances is just $n \times Var(X)$:
\[Var(\hat{p}) = \frac{1}{n^2} \cdot [n \cdot p_0(1-p_0)]\]Simplify the $n$ terms:
\[Var(\hat{p}) = \frac{p_0(1-p_0)}{n}\]d. From Variance to Standard Error
The Standard Error is simply the standard deviation of the sampling distribution. To get standard deviation from variance, we take the square root.
e. Why use $p_0$ instead of $\hat{p}$?
In a 1-sample hypothesis test, we calculate the standard error assuming the Null Hypothesis is true. The Null Hypothesis claims the true population rate is $p_0$. Therefore, the sampling distribution must be centered and spread according to that hypothesized value ($p_0$), not the data we just collected ($\hat{p}$).
2-Proportion Z-Test Example
Formulation: Used when comparing two independent proportions (e.g., conversion rate A vs. conversion rate B).
\[Z = \frac{\hat{p}_1 - \hat{p}_2}{\sqrt{\hat{p}(1 - \hat{p})\left(\frac{1}{n_1} + \frac{1}{n_2}\right)}}\]Where:
- ($\hat{p}_1$, $\hat{p}_2$): sample proportions
- ($n_1$, $n_2$): sample sizes
- ($\hat{p}$): pooled proportion
- Scenario: A company wants to compare two email subject lines (A vs. B) to see which produces a higher open rate.
- Version A: ($n_1 = 1000$) emails sent, ($x_1 = 180$) opens $\rightarrow$ ($\hat{p}_1 = 0.18$)
- Version B: ($n_2 = 1200$) emails sent, ($x_2 = 264$) opens $\rightarrow$ ($\hat{p}_2 = 0.22$)
- Hypothesis: $H_0 : p_1 = p_2$; $H_a : p_1 \neq p_2$. This is a two-tailed test.
Critical Value: At ($\alpha = 0.05$):
\[Z_{\text{crit}} = \pm 1.96\]Reject $H_0$ if ($\lvert Z \rvert > 1.96$).
Calculation of the Pooled Variance: Under the null hypothesis ($p_1 = p_2 = p$), the best estimate of the common proportion is the pooled estimator:
- Combine successes: $x = x_1 + x_2 = 180 + 264 = 444$
- Combine sample sizes: $n = n_1 + n_2 = 1000 + 1200 = 2200$
- Compute pooled proportion:
- Use pooled variance in Z-statistic:
This variance estimate is used because under ($H_0$), both samples share a common true proportion.
Calculation
\[Z = \frac{\hat{p}_1 - \hat{p}_2}{\sqrt{\hat{p}(1 - \hat{p})\left(\frac{1}{n_1} + \frac{1}{n_2}\right)}} = \frac{0.18 - 0.22}{\sqrt{0.2018 (1 - 0.2018)\left(\frac{1}{1000} + \frac{1}{1200}\right)}} \approx -2.33\]- Decision Rule: Since ($Z = -2.33$) and ($\lvert -2.33 \rvert > 1.96$), we reject the null hypothesis.
- Conclusion: There is statistically significant evidence at the 5% level that email subject line B produces a different (in this case, higher) open rate than A.
- Action: Subject line B shows a significant improvement and should be used or further optimized.
Derivation of the Pooled Standard Error (SE)
The Pooled Standard Error is used specifically when calculating the Z-statistic for hypothesis testing. The original Z-statistic equation is given below.
\[Z = \frac{\hat{p}_1 - \hat{p}_2} {\sqrt{\frac{\hat{p}_1 (1 - \hat{p}_1)}{n_1} + \frac{\hat{p}_2 (1 - \hat{p}_2)}{n_2}}}\]Step 1: The Null Hypothesis Assumption The Z-test starts with the Null Hypothesis ($H_0$) that there is no difference between the groups.
\[H_0: p_1 = p_2 = p\]If $H_0$ is true, the two samples actually come from the exact same population. Therefore, it is more accurate to combine (pool) them to estimate a single common proportion, $\hat{p}_{pool}$.
Step 2: Calculate the Pooled Proportion
\[\hat{p}_{pool} = \frac{\text{Total Successes}}{\text{Total Observations}} = \frac{x_1 + x_2}{n_1 + n_2}\]Step 3: Substitute into the Variance Equation
Because we assume $p_1$ and $p_2$ are the same: (\(p_1 = p_2 = \hat{p}_{pool}\)), we substitute $\hat{p}_{pool}$ into the ‘un-pooled’ variance equation below.
Factor out the common term \(\hat{p}_{pool}(1-\hat{p}_{pool})\):
\[Var_{pooled} = \hat{p}_{pool}(1-\hat{p}_{pool}) \left( \frac{1}{n_1} + \frac{1}{n_2} \right)\]Step 4: Calculate Standard Error The Standard Error is simply the square root of the variance.
\[SE_{pooled} = \sqrt{ \hat{p}_{pool}(1-\hat{p}_{pool}) \left( \frac{1}{n_1} + \frac{1}{n_2} \right) }\]Test SE vs. interval SE. The pooled standard error is for the hypothesis test, where $H_0$ asserts a single common proportion, so it is correct to estimate one shared $\hat{p}_{pool}$. A confidence interval for the difference $p_1 - p_2$, however, does not assume the two rates are equal, so it uses the unpooled standard error $\sqrt{\hat{p}_1(1-\hat{p}_1)/n_1 + \hat{p}_2(1-\hat{p}_2)/n_2}$ shown at the start of this derivation. The two procedures usually agree on the decision but are genuinely computed differently. Both also lean on a normal approximation that needs a healthy count of successes and failures in each cell (a rough floor is about 10 each); for sparse binary data, prefer an exact test such as Fisher’s.
6. Hypothesis Testing via T-Test (Means)
1-Sample T-Test Example
Formulation: Used when comparing a sample mean ($\bar{x}$) to a known population mean ($\mu_0$), but the population standard deviation is unknown. We estimate the standard deviation using the sample standard deviation (s).
\[t = \frac{\bar{x} - \mu_0}{\frac{s}{\sqrt{n}}}\]- ($\bar{x}$): Sample mean
- ($\mu_0$): Hypothesized population mean
- ($s$): Sample standard deviation
- ($n$): Sample size
Scenario: A nutritionist claims that a protein bar contains 20g of protein on average.
We suspect the actual mean is different.
Since the population standard deviation is unknown, we collect a sample of 25 bars and measure their protein content.Suppose our sample results are: ($\bar{x}$ = 19.2)g, ($s$ = 2.5)g
- Hypothesis: $H_0 : \mu = 20$; $H_a : \mu \neq 20$. This is a two-tailed test.
- Degrees of Freedom: $df = n - 1 = 25 - 1 = 24$
Critical Value: At ($\alpha = 0.05$) with ($df = 24$), the two-sided critical value is:
\[t_{\text{crit}} = \pm 2.064\]Reject $H_0$ if ($\lvert t \rvert > 2.064$).
Calculation:
\[t = \frac{19.2 - 20}{2.5 / \sqrt{25}} = \frac{-0.8}{0.5} = -1.6\]- Decision Rule: Since ($\lvert t \rvert = 1.6$) and (1.6 < 2.064), we fail to reject the null hypothesis.
- Conclusion: There is not enough evidence to conclude that the true mean protein content differs from 20g.
- Action: No immediate concern; more data or a larger sample may be needed for a definitive conclusion.
2-Sample T-Test Example
Formulation: Used when comparing two independent sample means when population standard deviations are unknown. The test statistic is:
\[t = \frac{\bar{x}_1 - \bar{x}_2}{ \sqrt{\frac{s_1^2}{n_1} + \frac{s_2^2}{n_2}}}\]- ($\bar{x}_1$, $\bar{x}_2$): Sample means
- ($s_1$, $s_2$): Sample standard deviations
- ($n_1$, $n_2$): Sample sizes
This is the Welch’s t-test, which does not assume equal variances. Welch is the sensible default for comparing two independent means; reach for the equal-variance (pooled) Student t only when equal variances are substantively justified, since the equal-variance assumption buys little and can mislead when it fails.
Scenario: A school wants to know whether two different teaching methods lead to different average test scores.
- Method A: ($n_1 = 30$), ($\bar{x}_1 = 78$), ($s_1 = 10$)
- Method B: ($n_2 = 28$), ($\bar{x}_2 = 72$), ($s_2 = 12$)
- Hypothesis: $H_0: \mu_1 = \mu_2$; $H_a: \mu_1 \neq \mu_2$. This is a two-tailed test.
Degrees of Freedom: Welch’s formula:
\[df = \frac{\left(\frac{s_1^2}{n_1} + \frac{s_2^2}{n_2}\right)^2} {\frac{(s_1^2/n_1)^2}{n_1 - 1} + \frac{(s_2^2/n_2)^2}{n_2 - 1}}\]Compute:
\[\frac{s_1^2}{n_1} = \frac{100}{30} = 3.333\] \[\frac{s_2^2}{n_2} = \frac{144}{28} = 5.143\] \[df \approx 53\]Critical Value: At ($\alpha = 0.05$), two-tailed:
\[t_{\text{crit}} \approx \pm 2.006\]- using df $\approx$ 53
- Calculation:
- Decision Rule: Since ($t$ = 2.06) and (2.06 > 2.006), we reject the null hypothesis.
- Conclusion: There is statistically significant evidence at the 5% level that the two teaching methods lead to different average test scores.
- Action: The school should consider adopting Method A more broadly or conducting further controlled experiments.
Proportion T-Test Example
Why it doesn’t exist: There is no “proportion t-test” because proportion data is based on the Binomial distribution. The variance of a proportion is directly tied to the mean ($Variance = p(1-p)$). Unlike continuous data (where we need a T-test to account for estimating both the mean and the unknown variance separately), with proportions, once we estimate the mean ($p$), we have automatically estimated the variance. As $n$ increases, the Binomial distribution is approximated by the Normal distribution, making the Z-test the correct tool.
The Handoff
A correct formula cannot rescue a poorly designed experiment. The next article moves upstream from the calculation: what to randomize, what to measure, and what decision the experiment is meant to support.
Resources
- NIST/SEMATECH e-Handbook: Two-Sample t-Test for Equal Means.
- Wasserstein, R. L. & Lazar, N. A. (2016). The ASA Statement on p-Values: Context, Process, and Purpose. The American Statistician, 70(2), 129-133.