Stats Primer: P-values & Confidence Intervals
This post bridges the probability distributions series to statistical inference. It sets up the z and t statistics and A/B-testing posts that follow.
In the realm of statistics, p-values and confidence intervals are fundamental tools that help us make sense of data and draw conclusions, particularly when dealing with samples and trying to understand a larger population. Let’s break down these concepts with some illustrative examples.
Understanding P-Values
What is a p-value?
The p-value, or probability value, is a measure that helps us determine the statistical significance of our results when conducting a hypothesis test. Precisely: assuming the null hypothesis (and the rest of the statistical model) is true, the p-value is the probability of obtaining a test statistic at least as extreme as the one we observed. The null hypothesis ($H_0$) generally represents the “status quo” or a statement of no effect or no difference.
How to interpret a p-value?
- Low p-value (typically ≤ 0.05): This indicates that our observed data is unlikely to have occurred by random chance if the null hypothesis were true. Therefore, we reject the null hypothesis in favor of the alternative hypothesis ($H_1$), which suggests there is a real effect or difference.
- High p-value (> 0.05): This means that our observed data is quite likely to have occurred even if the null hypothesis were true. Therefore, we fail to reject the null hypothesis. It’s important to note that this doesn’t prove the null hypothesis is true, only that we don’t have enough evidence to reject it.
The 0.05 threshold is a common convention, but it can be adjusted depending on the field and the desired level of certainty.
What a p-value is not. It is worth pinning down the common misreadings, because they are everywhere:
- it is not the probability that the null hypothesis is true;
- it is not the probability that the result is a false positive;
- it is not the probability the observed difference was “caused by chance”;
- it is not a measure of effect size or business importance.
A small p-value says the data are surprising under the null model, and nothing more on its own.
Example of a p-value:
Imagine a pharmaceutical company develops a new drug to lower blood pressure. They want to test if this new drug is more effective than an existing standard drug.
- Null Hypothesis ($H_0$): There is no difference in blood pressure reduction between the new drug and the standard drug.
- Alternative Hypothesis ($H_1$): The new drug leads to a greater reduction in blood pressure than the standard drug.
They conduct a clinical trial with two groups of patients. After the trial, they analyze the data and find that the group taking the new drug had an average blood pressure reduction of 15 mmHg, while the group on the standard drug had an average reduction of 10 mmHg.
They perform a statistical test, and the resulting p-value is 0.03.
Interpretation: Since the p-value (0.03) is less than the conventional threshold (0.05), they would reject the null hypothesis. Under a world where the new drug was no better than the standard, a difference this large (or larger) would occur only about 3% of the time. The honest conclusion is therefore narrow: the data are inconsistent with “no difference” at the 5% level, given the trial’s design and model assumptions. It is evidence that the new drug reduces blood pressure more, but it is not proof, and by itself it says nothing about how much more, or whether that difference is clinically important (the confidence interval, below, speaks to that).
Understanding Confidence Intervals
What is a confidence interval?
A confidence interval (CI) provides a range of plausible values for an unknown population parameter (like the mean or proportion) based on our sample data. It gives us an idea of how precise our estimate is and how much uncertainty there is.
A confidence interval is typically expressed as: Point Estimate ± Margin of Error.
The “confidence level” (commonly 95%, but can be 90%, 99%, etc.) indicates how confident we can be that the true population parameter lies within this interval.
How to interpret a confidence interval?
A 95% confidence interval means that if we were to repeat our study or experiment many times, 95% of the calculated confidence intervals would contain the true population parameter. It doesn’t mean there’s a 95% chance that our specific interval contains the true value (it either does or it doesn’t).
Example of a confidence interval:
Let’s say a market research firm wants to estimate the average amount of money a household in a particular city spends on groceries per week. They survey 200 households and find the average weekly spending is \$250.
They calculate a 95% confidence interval for the average weekly grocery spending to be $235 to $265.
Interpretation: They are 95% confident that the true average weekly grocery spending for all households in that city falls somewhere between $235 and $265.
This interval gives them a range of plausible values. A narrower interval would indicate a more precise estimate, while a wider interval would suggest more uncertainty.
The Relationship Between P-Values and Confidence Intervals
P-values and confidence intervals are closely related and often provide complementary information:
- Hypothesis Testing with CIs: If we are testing a hypothesis about a specific value, we can often use a confidence interval. For instance, in our drug example, if the 95% confidence interval for the difference in blood pressure reduction between the new and standard drug was, say, 2 mmHg to 8 mmHg, since this interval does not include zero (which would represent no difference), it would lead to the same conclusion as the p-value being less than 0.05 – we would reject the null hypothesis.
- When the equivalence holds: This “excludes zero ⟺ reject at 0.05” correspondence is exact only when the interval and the test use the same model and standard error, the same null value, corresponding levels (a 95% interval against a 5% test), and matched sidedness (a two-sided test for a two-sided interval). One-sided tests, variance-adjusted intervals, or a CI built with a different standard error than the test can disagree at the margin.
- Information Provided: A p-value gives us a single number representing the strength of evidence against the null hypothesis. A confidence interval, on the other hand, provides a range of plausible values for the effect size, which can be more informative in many practical situations.
In essence, both p-values and confidence intervals are crucial tools in statistics that allow researchers and data analysts to draw meaningful conclusions from data while acknowledging and quantifying the inherent uncertainty involved in working with samples.
Step-by-Step Procedure to Calculate the 95% Confidence Interval
Below, we’ll outline a step-by-step procedure to calculate the 95% confidence interval boundaries (\$235 and \$265) for the given example, assuming the sample mean is \$250, population standard deviation is 108.24 and the sample size is 200 households.
Step 1: Identify the Given Information
- Sample Mean $(\bar{x})$: \$250 (average weekly grocery spending from the survey).
- Population SD $(\sigma)$: 108.24
- Sample Size $(n)$: 200 households.
- Confidence Level $(CI)$: 95% (implies a significance level $\alpha = 0.05$, so the z-score for a two-tailed test is based on 95% of the area under the normal curve).
- Goal: Calculate the confidence interval boundaries (\$235, \$265).
- Assumptions:
- The sample size
n = 200is large, so the Central Limit Theorem applies, allowing us to use the normal distribution (z-distribution) rather than the t-distribution. - The data is approximately normally distributed or the sample is large enough for the sample mean to be normally distributed.
- The sample size
Step 2: Understand the Confidence Interval Formula
For a 95% confidence interval for the population mean $\mu$ when the population standard deviation $\sigma$ is known (or the sample is large enough that estimating it barely matters), we use:
\[\text{CI} = \bar{x} \pm z_{\alpha/2} \cdot \frac{\sigma}{\sqrt{n}}\]Where:
- $\bar{x}$: Sample mean (\$250).
- $z_{\alpha/2}$: Critical z-score for a 95% confidence level (two-tailed, so $\alpha/2 = 0.025$, and $z_{0.025} \approx 1.96$).
- $\sigma$: Population standard deviation (108.24).
- $n$: Sample size (200).
- $\frac{\sigma}{\sqrt{n}}$: Standard error (SE), which measures the variability of the sample mean.
The interval is:
\[\text{Lower bound} = \bar{x} - z_{\alpha/2} \cdot \frac{\sigma}{\sqrt{n}}, \quad \text{Upper bound} = \bar{x} + z_{\alpha/2} \cdot \frac{\sigma}{\sqrt{n}}\]Step 3: Determine the Critical Z-Score
For a 95% confidence interval:
- The confidence level is 95%, so $\alpha$ = 1 - 0.95 = 0.05.
- For a two-tailed test, we need the z-score that leaves 2.5% in each tail, so $\alpha/2$ = 0.025.
- From standard normal tables, the z-score for $P(Z < z) = 0.975$ is approximately $z = 1.96$.
Thus, $z_{\alpha/2} = 1.96$.
Step 4: Calculate the Standard Error
The standard error (SE) is:
\[\text{SE} = \frac{\sigma}{\sqrt{n}} = \frac{108.24}{\sqrt{200}} \approx \frac{108.24}{14.142} \approx 7.653\]Step 5: Compute the Confidence Interval
Using the formula:
\[\text{CI} = \bar{x} \pm z_{\alpha/2} \cdot \text{SE}\] \[\text{CI} = 250 \pm 1.96 \cdot 7.653\]Calculate the margin of error:
\[1.96 \cdot 7.653 \approx 15\]So:
\[\text{Lower bound} = 250 - 15 = 235\] \[\text{Upper bound} = 250 + 15 = 265\]The 95% confidence interval is \$235 to \$265, matching the given example.
Step 6: Verify Assumptions
- Large Sample Size: $n = 200$ is large, so the Central Limit Theorem makes the sample mean approximately normally distributed. Note that sample size alone does not guarantee normality: heavy skew, dependence, or outliers can still spoil the approximation, so this is a check to make rather than an automatic pass at any fixed cutoff.
- Known vs. estimated $\sigma$: We treated the population standard deviation $\sigma$ as known. In most real problems it is not, and must be estimated from the sample. That extra uncertainty replaces the z-distribution with the t-distribution, the subject of the next post.
Summary of the Procedure
- Collect Sample Data: Sample mean $\bar{x} = 250$, Population SD $\sigma = 108.24$, sample size $(n = 200)$.
- Determine Confidence Level: 95% implies $z_{\alpha/2} = 1.96$.
- Calculate Standard Error: $\text{SE} = \frac{\sigma}{\sqrt{n}} \approx 7.653$.
- Compute Interval: $\bar{x} \pm z_{\alpha/2} \cdot \text{SE} = 250 \pm 15 = (235, 265)$.
Common Misconception: The statement “95% confident” does not mean there’s a 95% chance the true mean is between \$235 and \$265. Instead, it means the method used to construct the interval is 95% reliable. The true mean is a fixed (unknown) value, not a random variable with a probability distribution.
The same few misreadings recur often enough to be worth tabulating:
| Tempting statement | More careful statement |
|---|---|
| “There is a 3% chance the null is true.” | “Under the null model, results at least this extreme occur about 3% of the time.” |
| “It is significant, so the effect is important.” | “The interval and a pre-set practical threshold decide whether the plausible effects matter.” |
| “A non-significant result proves there is no effect.” | “The data may be compatible with both zero and effects too small for this study to distinguish.” |
| “This interval has a 95% chance of containing the truth.” | “The interval came from a procedure with 95% long-run coverage under its assumptions.” |
An Example to Illustrate the Concept
Let’s extend the grocery spending scenario to make the concept concrete, using a simplified simulation to mimic the sampling process. Suppose the true (unknown) average weekly grocery spending for all households in the city is \$260 (we’ll use this for illustration, but in reality, we wouldn’t know it).
Scenario Setup
- Population: All households in the city.
- True Mean $(\mu)$: \$260 (unknown to the researchers).
- True Standard Deviation $(\sigma)$: \$108.24 (the population standard deviation used in the calculation above).
- Sample: The market research firm surveys 200 households, finding a sample mean $(\bar{x})$ of \$250.
- Confidence Interval: They calculate a 95% CI of \$235 to \$265.
Simulation of Repeated Sampling
Imagine the firm conducts the survey many times, each with a new random sample of 200 households. By the Central Limit Theorem, the sample mean $(\bar{x})$ is approximately normal with:
- Mean = $\mu = 260$.
- Standard error = $\frac{\sigma}{\sqrt{n}} = \frac{108.24}{\sqrt{200}} \approx 7.65$.
For each sample they build a 95% CI using $\bar{x} \pm 1.96 \cdot \frac{\sigma}{\sqrt{n}} = \bar{x} \pm 15$. Here is what might happen in five hypothetical samples:
- Sample 1: $\bar{x} = 250$, CI $= (235, 265)$. Contains the true mean (\$260).
- Sample 2: $\bar{x} = 255$, CI $= (240, 270)$. Contains \$260.
- Sample 3: $\bar{x} = 248$, CI $= (233, 263)$. Contains \$260.
- Sample 4: $\bar{x} = 270$, CI $= (255, 285)$. Contains \$260.
- Sample 5: $\bar{x} = 280$, CI $= (265, 295)$. Does not contain \$260.
Repeat this many times and about 95% of the intervals will contain the true mean. Note carefully what this does and does not say: the 95% is a property of the procedure across repeated samples, not of any single realized interval. Our particular CI of \$235 to \$265 either contains \$260 or it does not; there is no 95% probability attached to it after the fact.
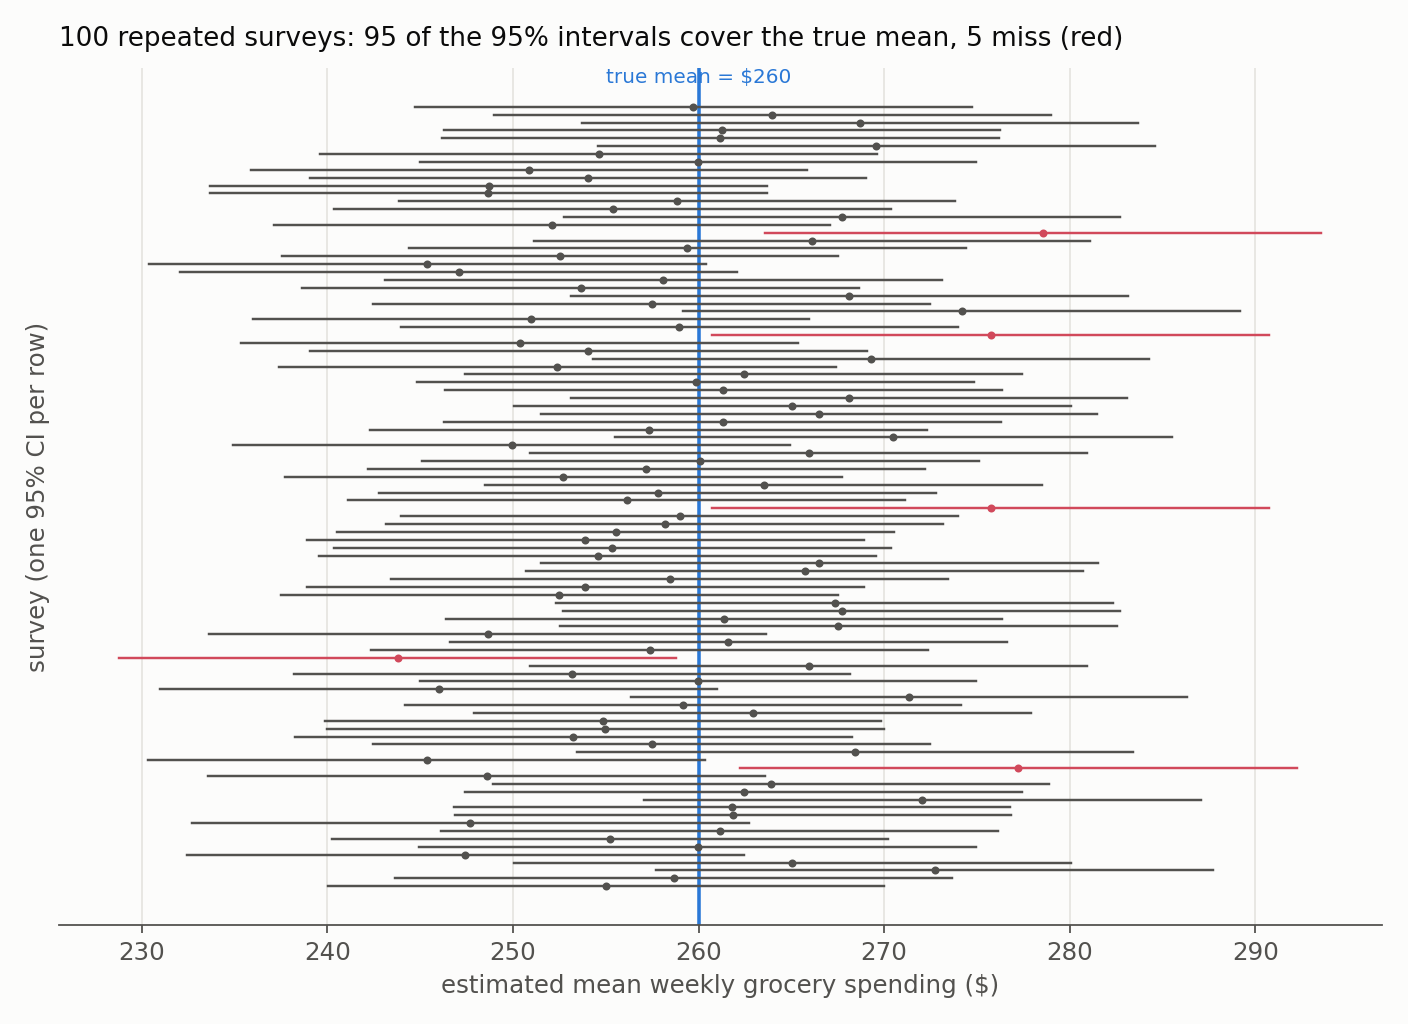
The figure shows exactly this: 100 repeated surveys, each producing one interval. Around 95 capture the true \$260 and about 5 miss entirely. “95% confidence” is that long-run hit rate.
Visualizing the Concept
A dartboard makes the same point. The bullseye is the true mean (\$260), and each sample’s interval is one dart throw: over many throws about 95% land on the bullseye, but any single throw either hits or misses. Our \$235-to-\$265 interval is one such throw, from a procedure that hits 95% of the time.
Resources
- Wasserstein, R. L. & Lazar, N. A. (2016). The ASA Statement on p-Values: Context, Process, and Purpose. The American Statistician, 70(2), 129-133.
- Greenland, S. et al. (2016). Statistical tests, P values, confidence intervals, and power: a guide to misinterpretations. European Journal of Epidemiology, 31, 337-350.