Probability Distribution: Binomial
The Binomial distribution counts successes in a fixed number of independent, equal-probability trials: model card, shape, a worked at-least calculation, and when it fails.
- A field guide to probability distributions
- Binomial You are here
- Geometric
- Negative Binomial
- Poisson
- Exponential
- Normal
- Log-Normal
- Laplace
- Gamma
- Beta
The Question It Answers
How many successes occur in a fixed number of independent, equal-chance attempts? If we flip a biased coin 20 times, the Binomial distribution describes the count of heads. The random variable $X$ is that count: a whole number between 0 and $n$.
| Field | Content |
|---|---|
| Type | Discrete |
| Random variable | $X$ = number of successes in $n$ trials |
| Support | $X \in \{0, 1, 2, \dots, n\}$ |
| Parameters | $n$ = number of trials (a count); $p$ = success probability per trial (dimensionless, $0 \le p \le 1$) |
| Mean | $np$ (trials times per-trial success chance) |
| Variance | $np(1-p)$ (largest at $p = 0.5$, zero at $p = 0$ or $1$) |
| Signature | A fixed number of independent, identical yes/no trials |
The model rests on four conditions, and each is a place it can break:
- Fixed $n$: the number of trials is set in advance.
- Binary outcomes: each trial is a success or a failure.
- Independence: trials do not influence each other.
- Constant $p$: every trial shares the same success probability.
Shape Before Formula
The single parameter $p$ controls both the center and the skew. With $n = 20$: at $p = 0.15$ the mass piles up near zero and the distribution leans right; at $p = 0.5$ it is symmetric around $np = 10$; at $p = 0.8$ it mirrors leftward toward the high end. The peak always sits near the mean $np$.
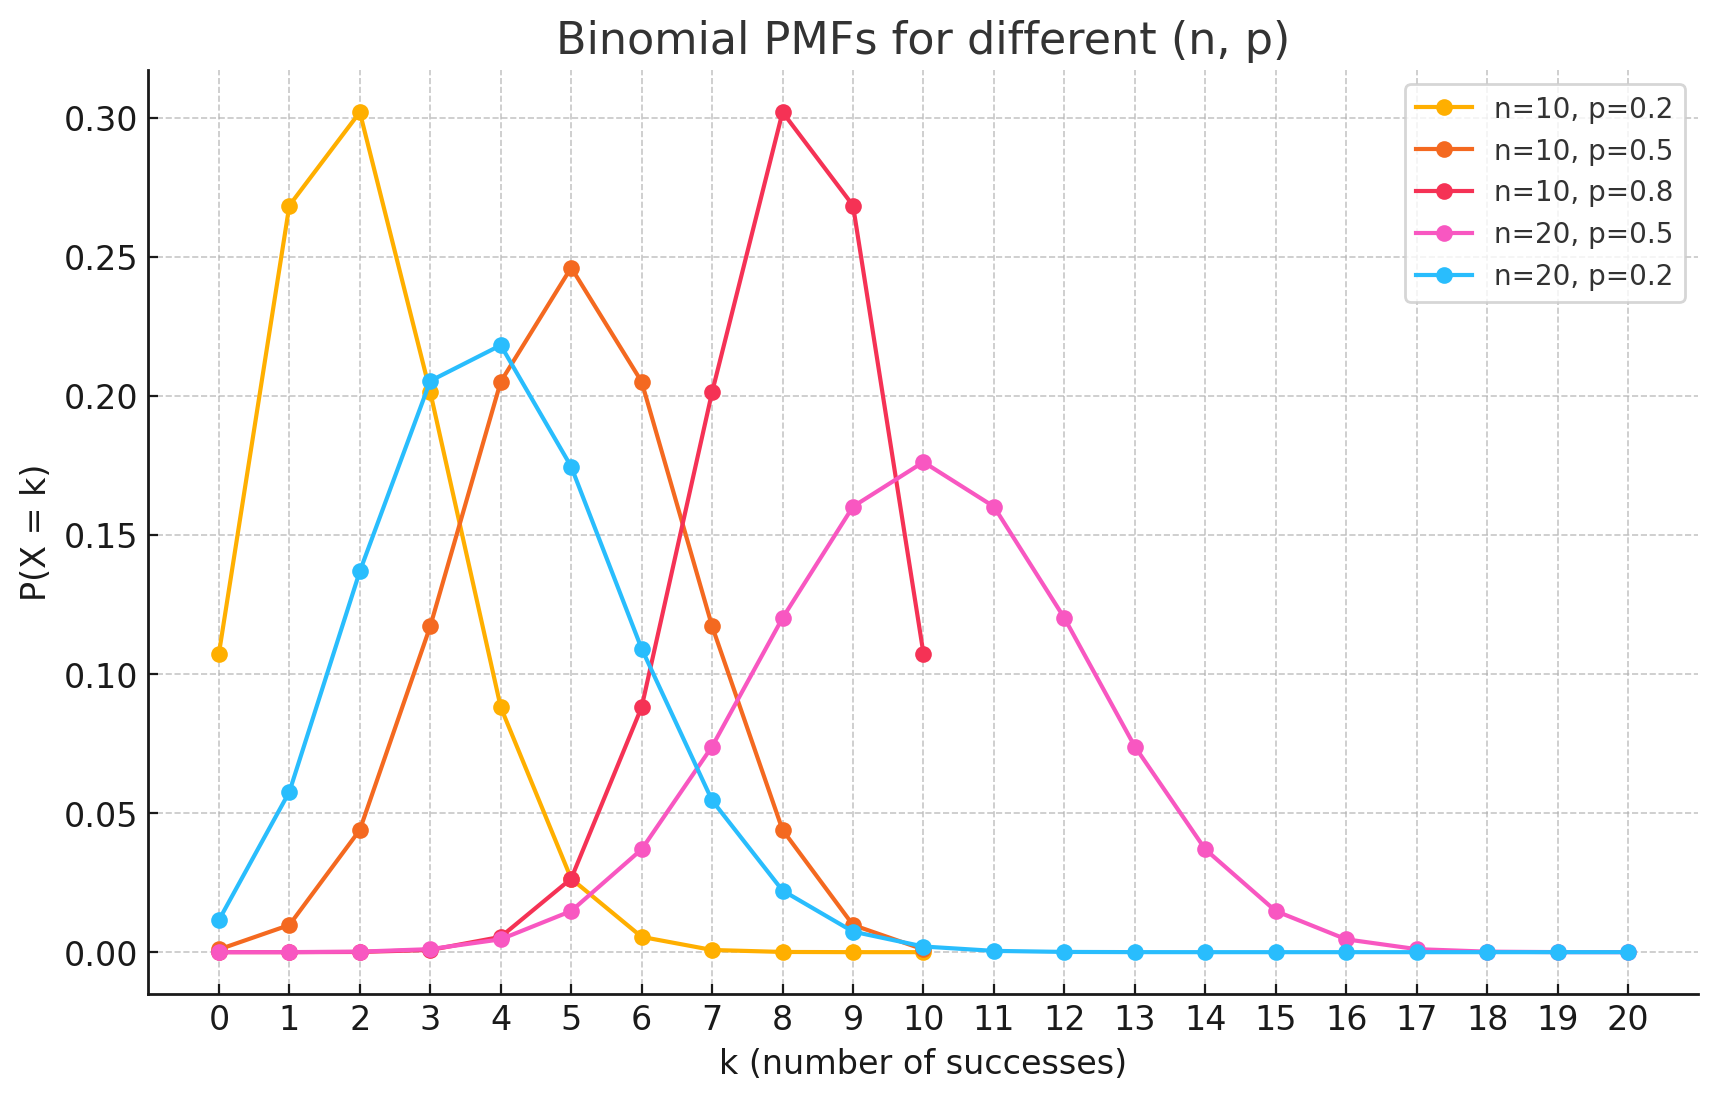
The probability mass function (PMF) gives the probability of exactly $k$ successes:
\[P(X=k) = \binom{n}{k} p^k (1-p)^{n-k}.\]Reading it left to right: $\binom{n}{k}$ counts which trials succeed, $p^k$ is the chance those $k$ succeed, and $(1-p)^{n-k}$ is the chance the rest fail.
A Worked Example: A Notification Experiment
Setup. We send a one-time push notification to 20 randomly chosen users, and historically about 15% click through ($p = 0.15$). Let $X$ be the number who click.
Check the assumptions first. Each user is a single yes/no trial; $n = 20$ is fixed; the users were chosen randomly, so treating the clicks as independent with a common $p$ is reasonable. (It would not be reasonable to count 20 notifications to the same user as independent trials: that user’s habits correlate the outcomes, breaking condition 3.)
Exactly four clicks. With $n = 20$, $k = 4$, $p = 0.15$:
\[P(X = 4) = \binom{20}{4}(0.15)^4(0.85)^{16} \approx 0.182.\]At least four clicks is the more decision-relevant question, and it is a survival probability, $P(X \ge 4) = 1 - P(X \le 3)$:
\[P(X \ge 4) = 1 - \sum_{k=0}^{3}\binom{20}{k}(0.15)^k(0.85)^{20-k} \approx 0.352.\]So even though the expected count is only $np = 3$, there is about a 35% chance of seeing four or more clicks. One reason the model might fail: if the 20 users are not exchangeable (say half are power users and half are dormant), a single $p$ misrepresents the mix, and the true spread is wider than $np(1-p)$ predicts.
Beyond “Exactly”: CDF, Survival, and Quantiles
Real questions rarely ask for one exact count. Three companion functions cover most of them:
- CDF, $F(k) = P(X \le k)$: “at most $k$ successes.”
- Survival, $S(k) = P(X > k)$: “more than $k$,” the upper tail.
- Quantile (PPF): the smallest $k$ with $F(k) \ge$ a target, answering “how many clicks would put us in the top 5% of outcomes?”
When It Fits, and When It Fails
| Assumes | A fixed count of independent trials with the same success probability |
| Common violation | $p$ drifts across trials, or trials are correlated (clustered users, learning effects) |
| Closest alternatives | Hypergeometric when sampling without replacement from a finite pool (the defect count in a fixed batch is exactly Hypergeometric, not Binomial); Poisson in the rare-event limit; Beta-Binomial when $p$ itself varies and the counts are overdispersed |
A practical warning: free-throw makes, survey responses, and defect counts are modeled as Binomial, but constant $p$ and independence are assumptions to check, not givens. A shooter warms up; a survey wave shares a mood; defects cluster by machine.
A Minimal Code Check
1
2
3
4
5
6
7
8
9
10
from scipy.stats import binom

n, p = 20, 0.15
binom.pmf(4, n, p)      # exactly 4        -> 0.182
binom.cdf(3, n, p)      # at most 3        -> 0.648
binom.sf(3, n, p)       # more than 3 (>=4)-> 0.352  (sf is 1 - cdf, done stably)
binom.ppf(0.95, n, p)   # 95th percentile  -> 6 successes

sample = binom.rvs(n, p, size=100_000, random_state=42)
sample.mean(), sample.var()   # ~3.0 and ~2.55, matching np and np(1-p)
Use sf rather than 1 - cdf for upper-tail probabilities: it is computed directly and stays accurate deep in the tail.
How It Connects
Bernoulli is the $n = 1$ case: a single trial. Binomial simply counts successes across $n$ of them.
Poisson is the Binomial’s rare-event limit, not a special case of it. As $n \to \infty$ and $p \to 0$ with the mean $np \to \lambda$ held fixed, the Binomial converges to a Poisson with rate $\lambda$. So a setting with a huge number of opportunities and a tiny per-opportunity chance (10,000 microchips, each defective with probability 0.0001) is well approximated by a Poisson with $\lambda = np = 1$:
\[P(X = 3) \approx \frac{\lambda^3 e^{-\lambda}}{3!} = \frac{1^3 e^{-1}}{6} \approx 0.061.\]There is no universal “$n > 50$, $p < 0.1$” rule for when this approximation is good enough; accuracy depends on both parameters and the precision required, so check it against the exact PMF for the case at hand. (And the exact Binomial is not actually hard to compute here: libraries evaluate the PMF through log-gamma functions, sidestepping the giant factorials.)
Appendix: Deriving the Mean and Variance
The clean route treats the Binomial count as a sum of $n$ independent Bernoulli indicators, $X = I_1 + \dots + I_n$, where $I_i = 1$ on success (probability $p$) and $0$ on failure. Both moments follow from the moments of a single indicator.
The Mean
A single indicator has expectation
\[E[I_i] = 1\cdot p + 0\cdot(1-p) = p.\]Expectation is linear regardless of any dependence between trials, so summing over all $n$:
\[E[X] = \sum_{i=1}^{n} E[I_i] = \sum_{i=1}^{n} p = np.\]The mean is just “trials times success chance.”
The Variance
Because $I_i$ takes only the values 0 and 1, $I_i^2 = I_i$, so $E[I_i^2] = p$ and
\[\text{Var}(I_i) = E[I_i^2] - (E[I_i])^2 = p - p^2 = p(1-p).\]The trials are independent, so the variance of their sum is the sum of the variances:
\[\text{Var}(X) = \sum_{i=1}^{n}\text{Var}(I_i) = np(1-p).\]This is largest at $p = 0.5$ and collapses to zero as $p \to 0$ or $p \to 1$, where each trial is nearly certain and carries no spread.
Where this sits in the series. This is the first post. Next concept: Geometric, trials until the first success. Closest cousins: Poisson (rare-event limit) and the Hypergeometric (sampling without replacement, not covered here). Series overview.