Probability Distribution: Exponential
The Exponential distribution models constant-rate waiting times: density is not probability, the survival and hazard functions, memorylessness, and when it fails.
- A field guide to probability distributions
- Binomial
- Geometric
- Negative Binomial
- Poisson
- Exponential You are here
- Normal
- Log-Normal
- Laplace
- Gamma
- Beta
The Question It Answers
How long until the next event, when events arrive at a constant average rate? If a call center’s calls follow a Poisson count, the Exponential distribution describes the time between those calls. It is the continuous-time twin of the Geometric: both measure a memoryless wait, one in continuous time, one in discrete trials.
| Field | Content |
|---|---|
| Type | Continuous |
| Random variable | $X$ = waiting time until the next event |
| Support | $X \ge 0$ |
| Parameters | $\lambda$ = rate (events per unit time; units of inverse time), so $1/\lambda$ has units of time |
| Mean | $1/\lambda$ (a rate of 5/hour gives a 12-minute average wait) |
| Variance | $1/\lambda^2$ |
| Signature | Memoryless; a constant hazard rate |
Shape Before Formula
The density starts at its highest value $\lambda$ (at $x=0$) and decays exponentially. A larger rate $\lambda$ means events come sooner, so the curve starts higher and falls faster.
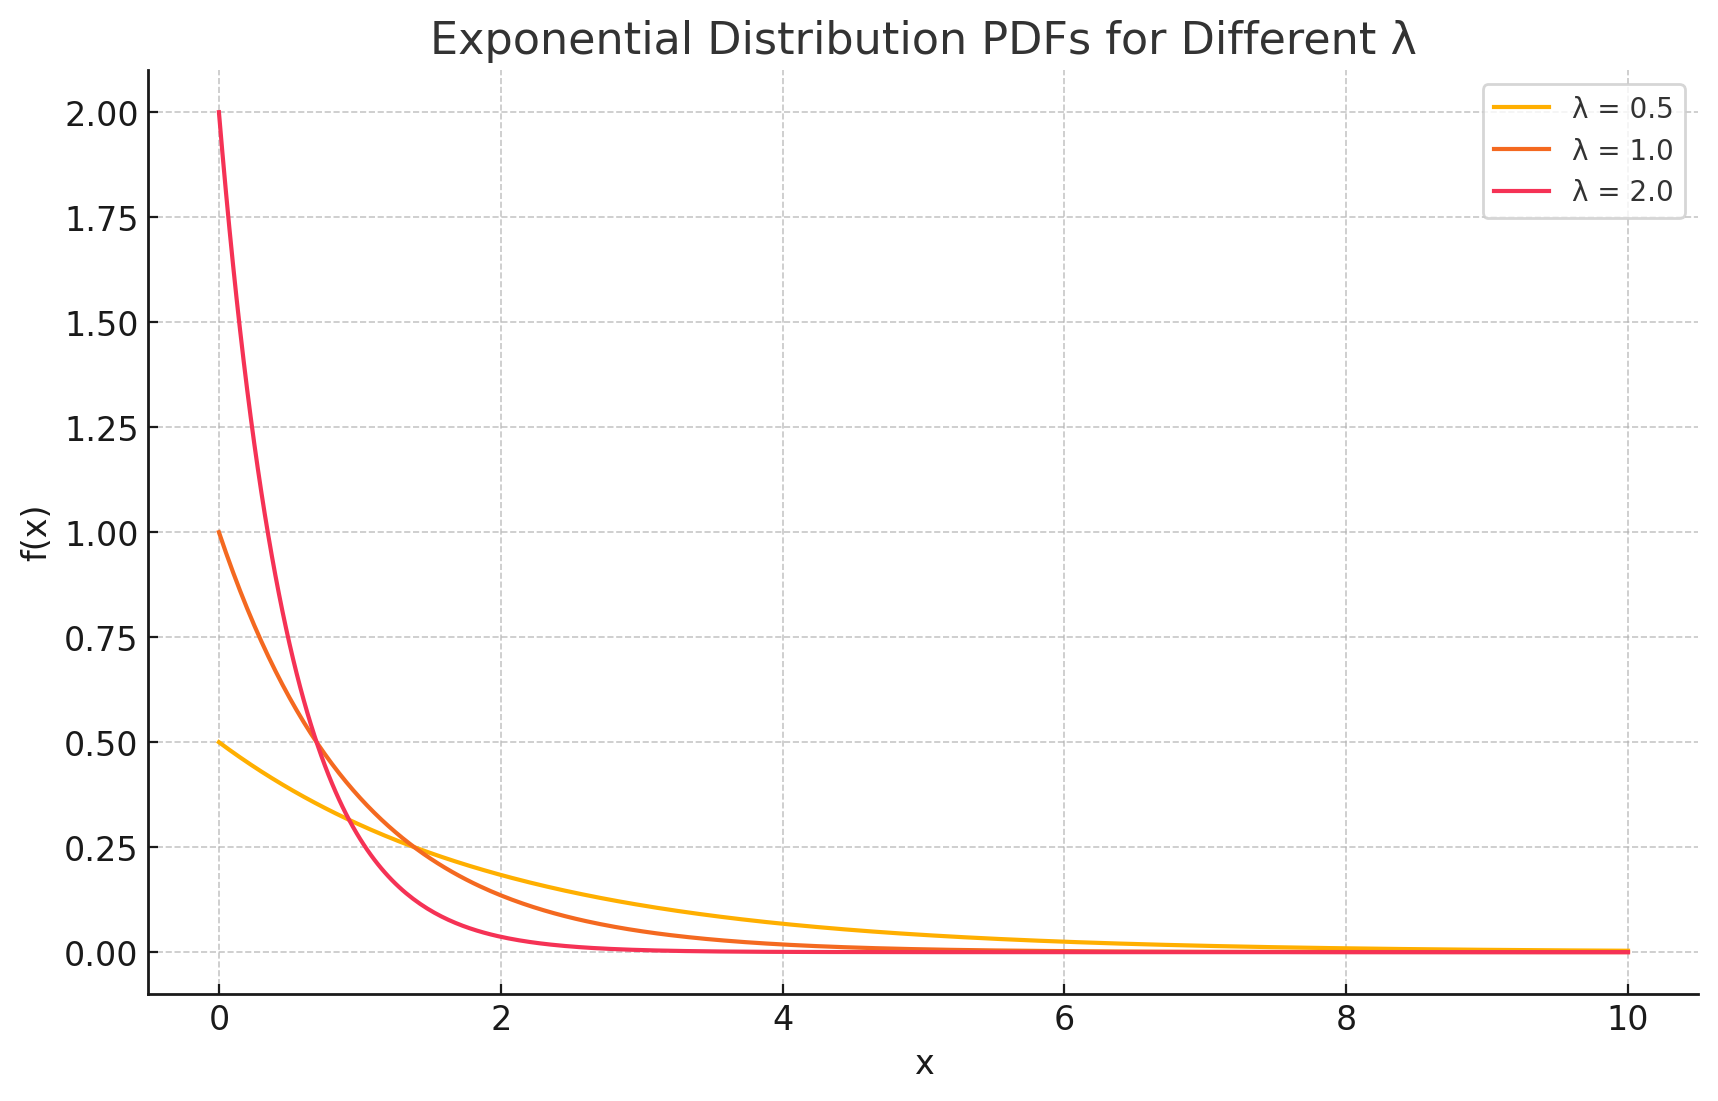
A crucial clarification: $f(x)$ is a density, not a probability. For a continuous variable $P(X = x) = 0$; probabilities are areas under the curve, $P(a \le X \le b) = \int_a^b f(x)\,dx$. The figure makes this concrete: at $\lambda = 2$ the density exceeds 1 near zero, which would be impossible for a probability but is perfectly fine for a density.
A Worked Example: Time Between Calls
Setup. Calls arrive at $\lambda = 5$ per hour, so the mean wait is $1/\lambda = 12$ minutes. Let $X$ be the time to the next call.
The interval probability has a clean closed form, $P(a \le X \le b) = e^{-\lambda a} - e^{-\lambda b}$:
- Next call within 5 minutes ($b = \tfrac{5}{60}$ hour): $P(X \le \tfrac{1}{12}) = 1 - e^{-5/12} \approx 0.341$.
- Between 5 and 15 minutes: $e^{-5(5/60)} - e^{-5(15/60)} \approx 0.373$.
Beyond the Density: CDF, Survival, and Hazard
Three functions carry most of the practical weight:
\[F(t) = P(X \le t) = 1 - e^{-\lambda t}, \qquad S(t) = P(X > t) = e^{-\lambda t}, \qquad h(t) = \frac{f(t)}{S(t)} = \lambda.\]The survival $S(t)$ is “still waiting after $t$,” and it is exactly the Poisson chance of zero events in $[0,t]$. The hazard $h(t) = \lambda$ is constant: the instantaneous chance of an event in the next moment never changes, no matter how long we have already waited.
Memorylessness
A constant hazard is the same statement as memorylessness:
\[P(X > s + t \mid X > s) = P(X > t).\]A component that has run for 5 hours is, under this model, exactly as likely to fail in the next hour as a brand-new one. That is realistic for genuinely random events (the next radioactive decay, an arrival in a stable queue) but implausible for anything that ages: human lifetimes, mechanical wear, and batteries all have a hazard that rises over time, so the Exponential understates late-life failure.
When It Fits, and When It Fails
| Assumes | A constant rate and a constant hazard: events with no memory of the past |
| Common violation | Aging or wear-out (rising hazard) and early-life “infant mortality” (falling hazard), the two ends of the bathtub curve |
| Closest relatives | Geometric (discrete analogue); Poisson (the count dual); Weibull or Gamma when the hazard is not constant |
Modeling an LED’s lifetime as Exponential assumes it fails at a constant rate rather than wearing out; that is a modeling choice to defend, not a default.
A Minimal Code Check
1
2
3
4
5
6
from scipy.stats import expon

lam = 5.0                        # rate per hour; scipy uses scale = 1/lam
expon.cdf(5/60, scale=1/lam)     # next call within 5 min -> 0.341
expon.sf(5/60, scale=1/lam)      # still waiting after 5 min -> 0.659
expon.ppf(0.5, scale=1/lam)      # median wait (hours) -> ~0.139 h (8.3 min)
Note the parameterization: scipy.stats.expon takes scale = 1/lambda, not a rate argument. The median $\ln(2)/\lambda$ is smaller than the mean $1/\lambda$, a reminder that the distribution is right-skewed.
Appendix: Deriving the Mean and Variance
Both moments come from integrating against the density $f(x) = \lambda e^{-\lambda x}$ on $[0, \infty)$, each by parts ($\int u\,dv = uv - \int v\,du$).
The Mean
\[E[X] = \int_{0}^{\infty} x\,\lambda e^{-\lambda x}\,dx.\]Take $u = x$ and $dv = \lambda e^{-\lambda x}\,dx$, so $v = -e^{-\lambda x}$:
\[E[X] = \Big[-x e^{-\lambda x}\Big]_{0}^{\infty} + \int_{0}^{\infty} e^{-\lambda x}\,dx.\]The boundary term vanishes at both ends (the exponential decays faster than $x$ grows), leaving
\[E[X] = \int_{0}^{\infty} e^{-\lambda x}\,dx = \frac{1}{\lambda}.\]The Variance
Using $\text{Var}(X) = E[X^2] - (E[X])^2$, we first find $E[X^2]$ by parts with $u = x^2$ and $dv = \lambda e^{-\lambda x}\,dx$:
\[E[X^2] = \Big[-x^2 e^{-\lambda x}\Big]_{0}^{\infty} + \int_{0}^{\infty} 2x\,e^{-\lambda x}\,dx = \frac{2}{\lambda}\int_{0}^{\infty} x\,\lambda e^{-\lambda x}\,dx.\]The remaining integral is exactly $E[X] = 1/\lambda$, so $E[X^2] = 2/\lambda^2$ and
\[\text{Var}(X) = \frac{2}{\lambda^2} - \frac{1}{\lambda^2} = \frac{1}{\lambda^2}.\]A faster rate $\lambda$ shortens both the average wait and its spread, which is exactly what “rate” should mean.
Where this sits in the series. Previous concept: Poisson (counting events). Next concept: Normal (additive continuous variation). Closest cousins: Geometric (discrete memoryless wait) and Poisson (the counting dual). Series overview.