From Conversion Pixels to Incrementality: What Did the Ad Actually Cause?
A practical guide to attribution rules, conversion deduplication, randomized holdouts, and the gap between credited revenue and causal lift.
- The invisible auction
- Who decides which ad gets served?
- The millisecond handshake
- ML in the millisecond
- The post-cookie frontier
- Learning the win curve
- From win curve to bidding
- Floor-price optimization
- What did the ad actually cause? You are here
Builds on ideas from the experimentation path: potential outcomes and causal inference and statistical power and sample size.
Priya sees an Urban Hiker boot ad while reading Wanderlust Weekly. Two days later, she searches for the brand, returns to the store, and buys a pair for ₹2,500. The campaign dashboard claims the purchase. Paid search claims it too. An affiliate platform may have its own claim. The commerce database simply records one order.
Which system is right?
That question sounds precise, but it hides two different questions:
- Which marketing touch should receive credit for the order? This is attribution.
- Would the order have happened if the campaign had not run? This is incrementality.
The first question is about matching and accounting. The second is about causality. Both matter, but no clever attribution rule turns the first into the second.
This distinction is easy to say and surprisingly expensive to ignore. A campaign can report a strong attributed return while producing little incremental revenue. A channel can also look weak under last-click attribution while creating demand that another channel collects. Before optimizing bids, budgets, or creative against a conversion metric, we need to know which question that metric actually answers.
1. One Purchase Is Assembled from Several Events
The millisecond handshake ended with a tracking pixel recording a later outcome. In production, that one sentence expands into an event graph owned by different systems:
| Event | Typical evidence | What it establishes |
|---|---|---|
| Ad opportunity | Auction or ad-server log | An ad could have been selected |
| Impression | Render or measurement beacon | A creative was rendered under a counting rule |
| Viewable impression | Viewability measurement | Enough of the creative was on screen for long enough |
| Click | Redirect or click log | A browser followed the ad link |
| Conversion | Browser pixel or server event | A business outcome was reported |
| Match | Cookie, click ID, login, or clean-room join | Two records probably belong to the same browser, account, or household |
| Attribution | Window and credit rule | A prior touch is eligible to receive credit |
Each row introduces another condition. A bid response is not a rendered impression. A render is not necessarily viewable. A click ID attached to a purchase is evidence of a path, not evidence that the click changed the purchase decision. The counting rules themselves are standardized territory: the Media Rating Council’s Outcomes and Data Quality Standards exist precisely because “an outcome happened” needs an audited definition before anyone argues about credit.
The conversion event itself also needs care. A browser pixel is easy to deploy, but it can be blocked, fired twice, or lost when the page closes. A server-to-server event is harder to block and can carry a stable order identifier, but it may include refunds, test orders, or events submitted by retrying jobs. Neither transport is automatically the source of truth.
A useful measurement record therefore has more structure than event=Purchase:
1
2
3
4
5
6
7
8
event_id        globally unique event identifier
order_id        merchant's deduplication key
event_time      when the outcome happened
received_time   when the measurement system received it
value           amount in a named currency, net or gross by definition
source          browser, app, server, offline import
consent_state   permissions applicable at collection time
match_key       click ID, account token, or another approved join key
The definitions are part of the data. If one platform reports gross basket value at checkout while another reports net revenue after cancellation, their conversion counts can agree while their revenue does not.
2. Attribution Is a Credit-Allocation Rule
Suppose Priya’s purchase follows this sequence:
1
2
3
4
Day 1: display impression
Day 3: paid-search click
Day 5: affiliate click
Day 5: purchase
An attribution system first chooses the eligible touches. A 7-day click window includes both clicks. A 1-day view-through window excludes the display impression. A 30-day view-through window includes it. The system then distributes credit across the eligible set.
| Rule | Credit assigned in this journey | Assumption embedded in the rule |
|---|---|---|
| Last click | 100% to affiliate | The final eligible click deserves all credit |
| First touch | 100% to display | The first observed introduction deserves all credit |
| Linear | Equal shares across eligible touches | Every touch contributes equally |
| Time decay | More credit to recent touches | Proximity is a useful proxy for influence |
| Position based | More to first and last touches | Introduction and closure matter most |
| Model based | Shares estimated from observed paths | Historical path patterns transfer to current traffic |
These rules can be useful. Finance may need one deterministic rule to reconcile invoices. A media team may need rapid feedback by campaign, placement, and creative. A bidding model may need a dense outcome label rather than waiting months for a market-level study.
But attribution has no untreated version of Priya. It observes that a purchase followed some touches, then applies a policy for assigning credit. Changing the window or rule changes the allocation even though the customer journey is identical.
The arithmetic also stops being a neutral fact once several platforms operate separate ledgers. If display, search, and affiliate systems each use their own window and identity graph, the same ₹2,500 order can be reported three times. Within one platform, fractional multi-touch credit might sum to one. Across platforms, no such conservation law exists.
Deduplication comes before interpretation
Attribution is already hard when every purchase appears once. Duplicate events make it worse.
A robust conversion pipeline should use a stable order_id or event_id as an idempotency key. Browser and server copies of the same purchase should reconcile to one canonical event. Retries should update or ignore an existing row rather than create another sale. Refunds and cancellations should arrive as explicit adjustments. Currency conversion and tax treatment should be defined before ROAS is computed.
Cross-channel deduplication is a separate problem. Two platforms can both hold technically valid evidence linking an order to an earlier touch. Deduplicating the order does not decide which platform deserves credit, and choosing a winner does not establish which platform caused the order. These are three distinct operations:
- Event reconciliation: How many real business outcomes occurred?
- Attribution: Which eligible touches receive accounting credit?
- Incrementality: How many outcomes changed because advertising was available?
Keeping those ledgers separate prevents a reporting convention from quietly becoming a causal claim.
3. A 4.0x Dashboard Can Describe a 0.75x Experiment
Consider one Urban Hiker campaign. We randomly assign 200,000 eligible people into two equally sized arms:
| Arm | People assigned | Purchases | Purchase rate |
|---|---|---|---|
| Control, ads withheld | 100,000 | 4,000 | 4.0% |
| Treatment, ads available | 100,000 | 4,600 | 4.6% |
In the treatment arm, auctions and page behavior allow 60,000 rendered impressions. Our attribution system matches 3,200 purchases to an eligible impression or click. Campaign spend is ₹2.0 million and average order value is ₹2,500.
The attribution dashboard computes:
\[\text{Attributed revenue} = 3{,}200 \times \text{₹}2{,}500 = \text{₹}8.0\text{ million}\]and therefore:
\[\text{Attributed ROAS} = \frac{\text{₹}8.0\text{ million}}{\text{₹}2.0\text{ million}} = 4.0\]That calculation is internally coherent. It says the system found ₹4 of credited revenue for every ₹1 spent. It does not say all ₹8 million disappeared when ads were withheld.
The randomized comparison estimates 600 additional purchases:
\[\text{Incremental purchases} = 4{,}600 - 4{,}000 = 600\]So the incremental revenue estimate is ₹1.5 million and incremental ROAS is:
\[\text{iROAS} = \frac{600 \times \text{₹}2{,}500}{\text{₹}2.0\text{ million}} = 0.75\]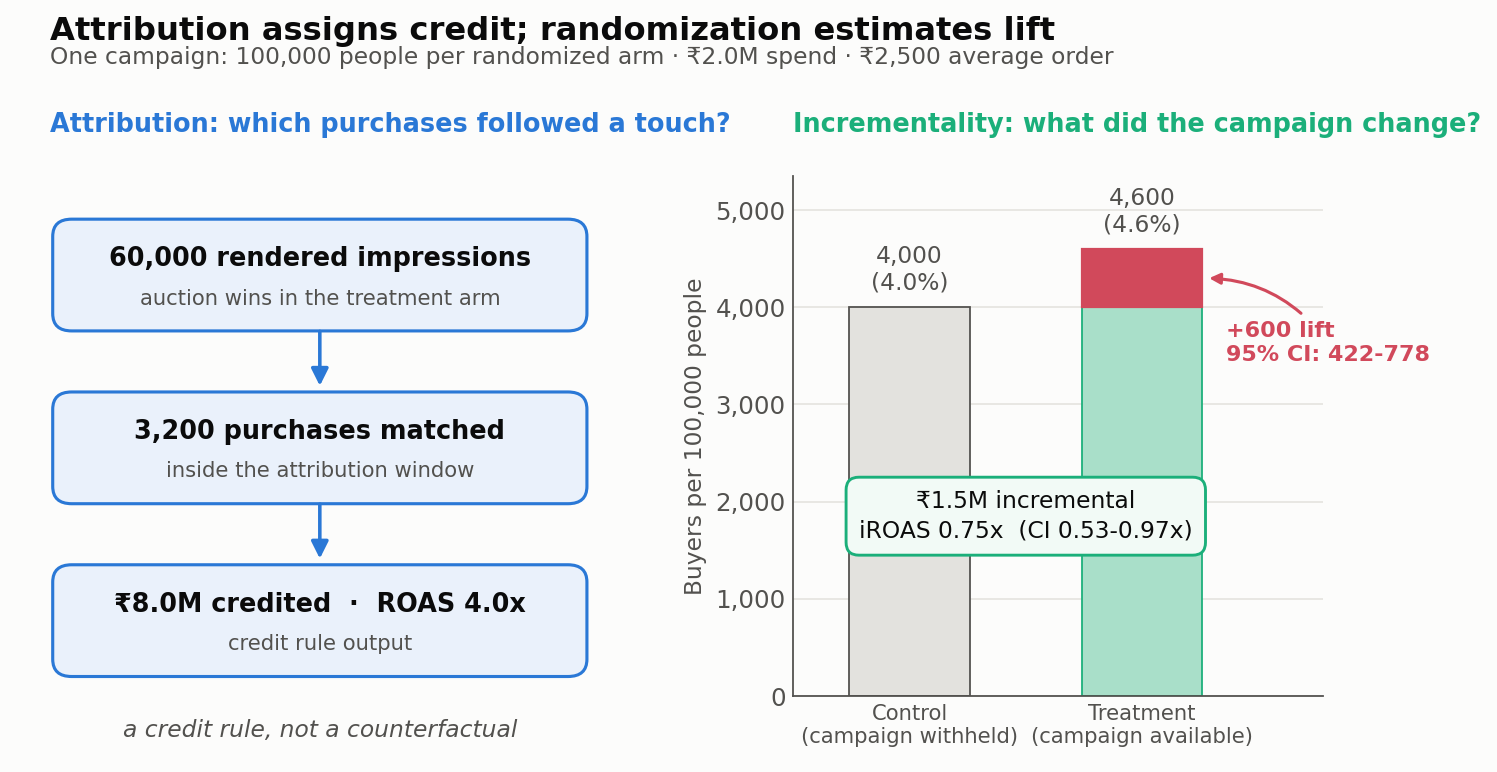
The gap is not a contradiction. Of the 3,200 attributed purchases, many would have happened without this campaign. The holdout supplies the missing baseline.
This is also revenue ROAS, not profit. If gross margin is 40%, the incremental gross profit associated with the point estimate is only ₹600,000 before other variable costs. A positive sales lift can still be uneconomic.
The estimate needs uncertainty
The observed lift is 0.6 percentage points. With independent randomized arms, an approximate standard error for the difference in purchase rates is:
\[SE = \sqrt{\frac{0.046(1-0.046)}{100{,}000} + \frac{0.040(1-0.040)}{100{,}000}} \approx 0.00091\]An approximate 95% confidence interval for the rate lift is therefore 0.42 to 0.78 percentage points. At this experiment size, that corresponds to roughly 422 to 778 incremental purchases per 100,000 treated people.
Carrying the interval through to money is where it bites. At ₹2,500 per order against ₹2.0 million of spend, 422 to 778 purchases translate to an iROAS between roughly 0.53 and 0.97: even the optimistic end of the interval fails to pay back the media cost at revenue level. And at 40% gross margin, breakeven requires iROAS of at least $1/0.4 = 2.5$. Under any reading of this experiment, the campaign is uneconomic; the uncertainty does not soften that conclusion, it sharpens it.
The point estimate of 600 is useful, but a budget decision should see the interval too. Advertising lift is often small relative to baseline conversion variance. Lewis and Rao’s field-experiment analysis found that even very large advertising experiments can leave wide ROI intervals. Precision is an economic constraint, not a cosmetic statistical add-on (the sample-size post covers the power arithmetic that decides it).
4. The Missing Object Is a Counterfactual
Let $Y_i(1)$ be person $i$’s purchase outcome when ads are available and $Y_i(0)$ the outcome when ads are withheld. The individual causal effect is:
\[Y_i(1) - Y_i(0)\]Only one outcome can be observed for the same person in the same period. This is the fundamental problem of causal inference, the same one our causal-inference post wrestles with in observational settings. Random assignment does not reveal both outcomes for Priya, but it makes the treatment and control groups comparable in expectation. Their average difference estimates:
\[ATE = E[Y(1) - Y(0)]\]Attribution usually conditions on exposure, clicks, or matchable identity. Those are selected post-assignment. People who receive an impression may visit more ad-supported pages, fit targeting criteria, win cheaper auctions, or already have stronger purchase intent. People who click are more selected still. Comparing converters who clicked with people who did not click answers almost nothing causal without much stronger assumptions.
This is why observational attribution models can remain biased even with thousands of features. In a comparison against 15 large Facebook field experiments, Gordon, Zettelmeyer, Bhargava, and Chapsky found that common observational approaches often failed to recover the experimental result. More covariates help describe selection; they do not guarantee that unobserved selection has vanished.
5. What a Useful Advertising Holdout Looks Like
The cleanest design randomizes eligible units before the ad decision:
1
2
3
4
5
6
7
8
eligible population
        |
  random assignment
     /       \
treatment   control
ads may run ads withheld
     \       /
   compare outcomes
The primary result should usually be intention to treat: the outcome difference between everyone assigned to treatment and everyone assigned to control. In the example, only 60% of the treatment arm received a rendered impression. That does not justify dropping the other 40%. They were part of the policy being tested, including its auction losses, pacing, eligibility filters, and missed renders.
A simple holdout still needs design choices:
- Randomization unit: browser, account, household, geography, or time block. The unit should limit contamination across arms.
- Eligibility: define the population before assignment. Restricting analysis to people selected after treatment can reintroduce bias.
- Control experience: show no ad, a neutral public-service ad, or a “ghost ad” marker when the treatment ad would have won. Each measures a slightly different policy contrast.
- Outcome window: allow enough time for delayed conversions, while avoiding unrelated outcomes accumulating forever.
- Sample size: power the study for plausible lift, not for the much larger baseline conversion rate.
- Interference: one person’s exposure can affect another person’s outcome. Household purchases and marketplace effects can violate the assumption that units do not influence one another.
- Attrition and matching: outcome visibility must not differ across arms because one arm is easier to identify.
Ghost-ad designs are especially helpful in auction environments. Rather than buying a public-service ad for every control opportunity, the platform can record when the focal ad would have won and identify a comparable control opportunity without showing it. Johnson, Lewis, and Nubbemeyer show how this can improve the economics and precision of online ad-effectiveness measurement. It still requires trustworthy randomization and platform instrumentation.
When individual randomization is impossible, geo experiments and time-based switchbacks can estimate broader effects. They trade more modeling assumptions and fewer independent units for reduced cross-arm contamination. Marketing mix models work at an even more aggregated level and can help allocate budgets across long periods and channels, but they do not replace clean experiment design when randomization is feasible.
6. Privacy Changes the Matching Layer, Not the Causal Question
Traditional cross-site attribution relied on a browser identifier appearing near both the ad interaction and the conversion. Browser restrictions, consent requirements, and identifier loss make that join less available; the post-cookie frontier covered why that identity layer eroded. Measurement systems are responding in several ways:
- first-party click IDs and server-side conversion events;
- consented account or customer-data joins;
- aggregate reporting with delayed or noisy outputs;
- data clean rooms that constrain how parties match and query records;
- on-device or browser-mediated attribution APIs.
Chrome’s Attribution Reporting API separates coarse event-level reports from aggregate summary reports and introduces delay, aggregation, and noise to reduce cross-site tracking risk. The W3C’s Attribution Level 1 working draft, from the Private Advertising Technology Working Group, formalizes a related browser-API direction. WebKit’s Private Click Measurement describes a different browser design built around limited data and delayed reports. The important operational point is that browser support and semantics are not one universal standard.
Clean-room matching has a different role. The IAB Tech Lab’s ADMaP specification describes privacy-oriented matching based on authenticated first-party data and controlled processing. That can improve reach measurement or reconcile records without exposing raw identifiers to every participant.
None of these mechanisms manufactures a counterfactual. A privacy-preserving report can still be last-click attribution. A deterministic clean-room join can still connect an ad to a purchase that would have happened anyway. Privacy technology can make data use safer; causality still comes from design, usually random assignment or a defensible quasi-experiment.
Aggregate and noisy reports also change optimization. A platform cannot always use a delayed, noised event as if it were a precise per-user billing record or an immediate training label. Measurement architecture now has to state which outputs support campaign feedback, which support finance, and which support causal evaluation.
7. Keep Three Ledgers, and Label Every Number
A mature measurement system should resist collapsing all questions into one “conversion” column.
The event ledger counts business outcomes. It owns order reconciliation, refunds, currency, tax, and duplicate handling. Its job is to answer: what happened?
The attribution ledger connects eligible marketing touches to those outcomes under a declared rule. It owns identity scope, lookback windows, view-through policy, and credit allocation. Its job is to answer: which touches receive credit?
The incrementality ledger compares outcomes under different advertising policies. It owns randomization, treatment assignment, control integrity, confidence intervals, and experiment exclusions. Its job is to answer: what changed because the policy ran?
Every reported performance number should carry enough metadata to reveal its ledger:
1
2
3
4
5
6
7
metric: attributed_roas
attribution_rule: last_non_direct_click
click_window: 7 days
view_window: disabled
identity_scope: consented account or first-party click ID
revenue_basis: net of cancellations, before tax
as_of: 14 days after conversion
An incremental result needs a different contract:
1
2
3
4
5
6
metric: incremental_roas
estimand: intention_to_treat
randomization_unit: account
population: campaign-eligible accounts
outcome_window: 14 days
interval: 95% confidence interval
This discipline also clarifies power. Attribution platforms have an incentive to claim conversions because credit influences budget. Advertisers have an incentive to compare claims with their own event ledger and with independent experiments. Publishers and browsers influence which events can be observed at all. Measurement is not merely a technical join; it is a negotiated system of evidence among parties with different incentives.
8. The Practical Hierarchy
Attribution is not useless because it is not causal. It is fast, granular, and operationally necessary. Incrementality is not automatically superior for every task. Experiments can be slow, expensive, underpowered, and too coarse for creative-level optimization.
The productive hierarchy is:
- Reconcile real outcomes in the event ledger.
- Use a clearly named attribution rule for routine reporting and feedback.
- Run experiments at intervals to estimate causal lift and calibrate the attribution system.
- Optimize to business value using both, with uncertainty and margin visible.
The key is calibration. If attributed ROAS is 4.0x while repeated experiments place iROAS near 0.75x, the dashboard should not continue presenting its credit as incremental revenue. The attributed metric can remain useful, but budget planning needs the experimental correction.
The next time a dashboard says an ad “drove” a purchase, the immediate question is not whether the join was technically sophisticated. It is whether the number came from a credit rule or a counterfactual comparison. That one label separates a conversion path from a causal result.
References
- Gordon, B. R., Zettelmeyer, F., Bhargava, N., and Chapsky, D. (2019). A Comparison of Approaches to Advertising Measurement: Evidence from Big Field Experiments at Facebook. Marketing Science, 38(2), 193-225.
- Johnson, G. A., Lewis, R. A., and Nubbemeyer, E. I. (2017). Ghost Ads: Improving the Economics of Measuring Online Ad Effectiveness. Journal of Marketing Research, 54(6), 867-884.
- Lewis, R. A., and Rao, J. M. (2015). The Unfavorable Economics of Measuring the Returns to Advertising. The Quarterly Journal of Economics, 130(4), 1941-1973.
- Media Rating Council. (2022). Outcomes and Data Quality Standards.